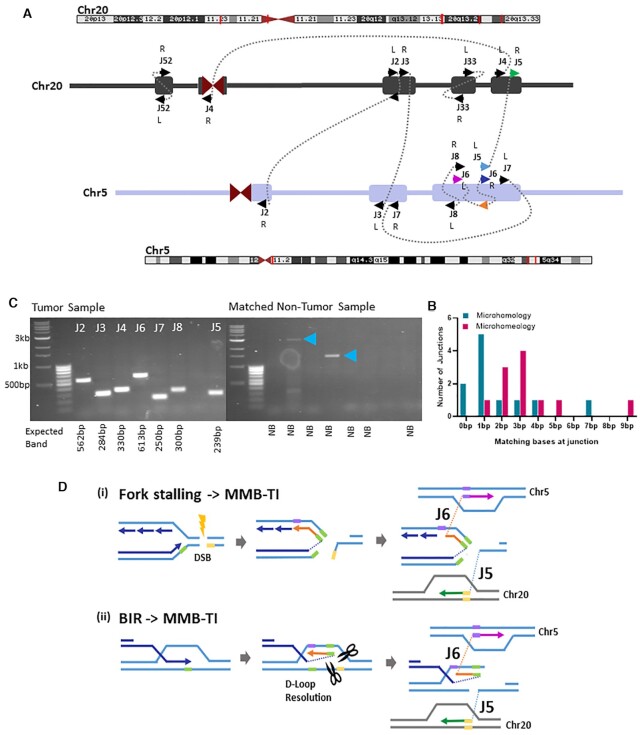
Figure 7.
Sub-clonal MMB-TI events associated with multiple additional breakpoints on Chromosomes 5 and 20. (A) Schematic of all junctions found on Chromosomes 5 and 20. Chromosome positions (red lines on banding diagram) correspond to each cluster of junctions (Rectangles on schematic). L or R indicates Left or Right side of junction with respect to the 5′ to 3′ reference genome. Arrows points indicate forward (to right) or reverse (to left) strands. Arrow colors correspond to the model shown in (D). (B) Distribution of microhomology and microhomeology at all junctions shown in (A) (see Supplementary Data S18 for individual junction counts). (C) PCR confirmation of MMB-TI -related rearrangement junctions shown in (A). Primers were designed to anneal at positions 100–300 bp from the rearrangement junctions and expected band sizes are listed below each lane. Blue arrowheads indicate non-specific bands in non-tumor control reactions. (D) Two Models for the formation of junctions J5 and J6 shown in (A): (i) replication fork stalling at a damage site (DSB) leads to template switching of the leading strand to the lagging strand template, and subsequent template switching to distant site on Chromosome 5, while a second broken end invades Chromosome 20. (ii) During BIR, the leading strand template switches to the opposite strand within the D-loop structure. D-loop resolution then yields two broken DNA ends that invade different regions on Chromosome 5 and Chromosome 20. Both scenarios lead to genomic rearrangements initiated at an MMB-TI event.

