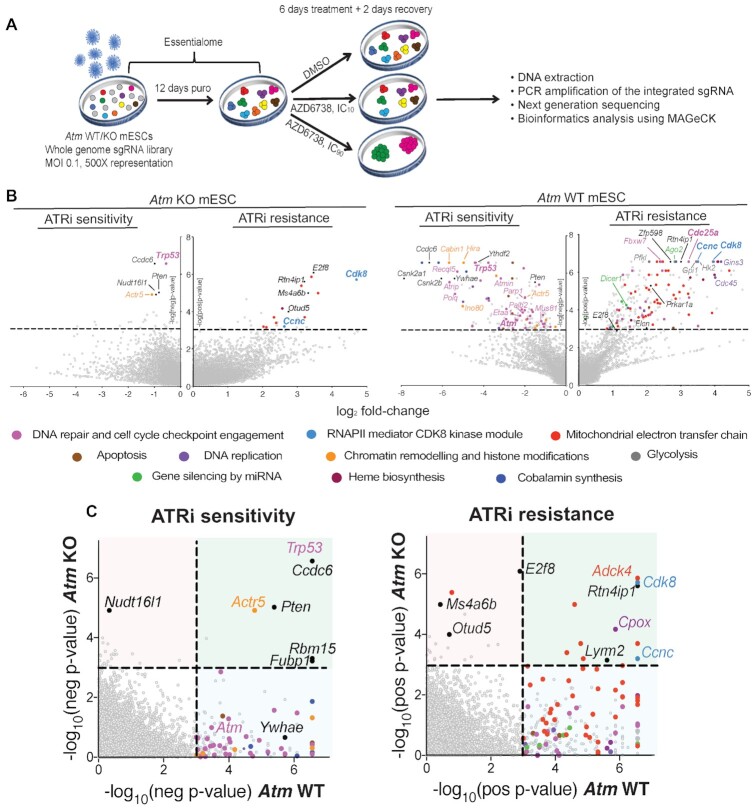
Figure 1.
CRISPR–Cas9 screens using AZD6738 in Atm WT and KO mESCs. (A) Schematic of CRISPR–Cas9 screens performed in this study. (B) Drop-out and enrichment analyses following AZD6738 treatment in Atm WT and KO mESCs. Genes were statistically ranked using MAGeCK analysis software, and top hits with a P-value < 0.001 classified into related pathways and complexes. Dashed line = P-value of 0.001. Two MAGeCK analysis methods were performed for both IC10 and IC90 doses, and all analyses can be found in Supplementary Table S1 and Supplementary Figure S2A. The analyses that provided the greatest number of significant drop-out or enrichment hits (FDR < 0.1) for each genotype are presented. (C) Drop-out and enrichment analyses following AZD6738 treatment from Figure 1B, comparing MAGeCK P-values for each gene between Atm WT and Atm KO mESCs. A P-value of 0.001 is indicated by the dotted line. Genes in the upper right quadrant were hits in both cells lines, upper left quadrant were hits only in Atm KO cells, and those in the bottom right quadrant were hits only in Atm WT cells. Top hits in one or both cell lines are colour coded based on the same classification as Figure 1B.

