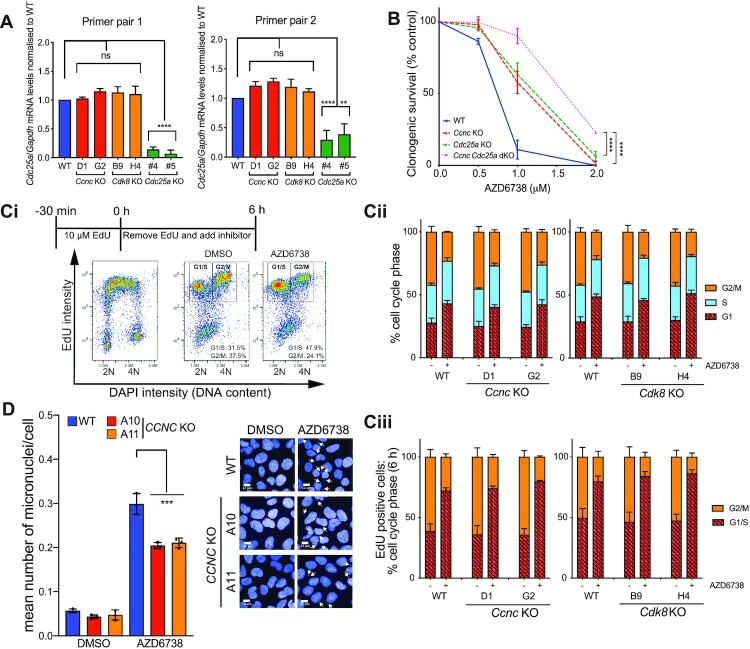
Figure 4.
Loss of Cyclin C/CDK8 promotes ATRi resistance independent of CDC25A or G2/M checkpoint regulation. (A) Cdc25a mRNA transcript levels in WT and Ccnc/Cdk8 KO mESCs as assessed by RT-qPCR using two independent primer pairs. Transcript levels are normalised to the house-keeping gene Gapdh. Cdc25a KO mESCs (24) were used as a control. Error bars = mean ± SEM (biological n = 4 WT, Cdk8 KO, Ccnc KO; n = 2 Cdc25a KO). (B) Clonogenic survivals of isogenic WT and de novo generated Ccnc/Cdc25a single and dual KO mESCs treated with AZD6738. Error bars = mean ± SD (biological n = 3). (C) Actively replicating S-phase Ccnc and Cdk8 WT and KO mESCs were pulse-labelled with 10 μM EdU for 30 min prior to release into media containing DMSO or 900 nM AZD6738 for 6 h. Error bars = mean ± SEM (biological n = 3 Ccnc KO, n = 4 Cdk8 KO). (i) Schematic of experimental design and gating strategy using FACS profiles in WT mESCs. (ii) Cell cycle distributions based on DAPI histograms. iii) Distribution of EdU positive cells between G1/S and G2/M 6 h after removal of EdU. DNA content 2N = G1, 4N = G2/M. EdU positive cells were actively replicating at the time of EdU labelling. (D) Mean number of micronuclei/cell after 24 h treatment with DMSO or 1.5 μM AZD6738 in U2-OS CCNC WT and KO cells. Error bars = mean ± SD (biological n = 3). Arrows indicate micronuclei in the representative images. Representative images were taken at 40× magnification, scale bars = 12 μm. All statistical analyses were performed using a one-way ANOVA test with multiple comparisons, except in Figure 3B where a two-way ANOVA test was used. P-values < 0.05 (*), 0.01 (**), 0.001 (***) and 0.0001 (****) were deemed statistically significant.

