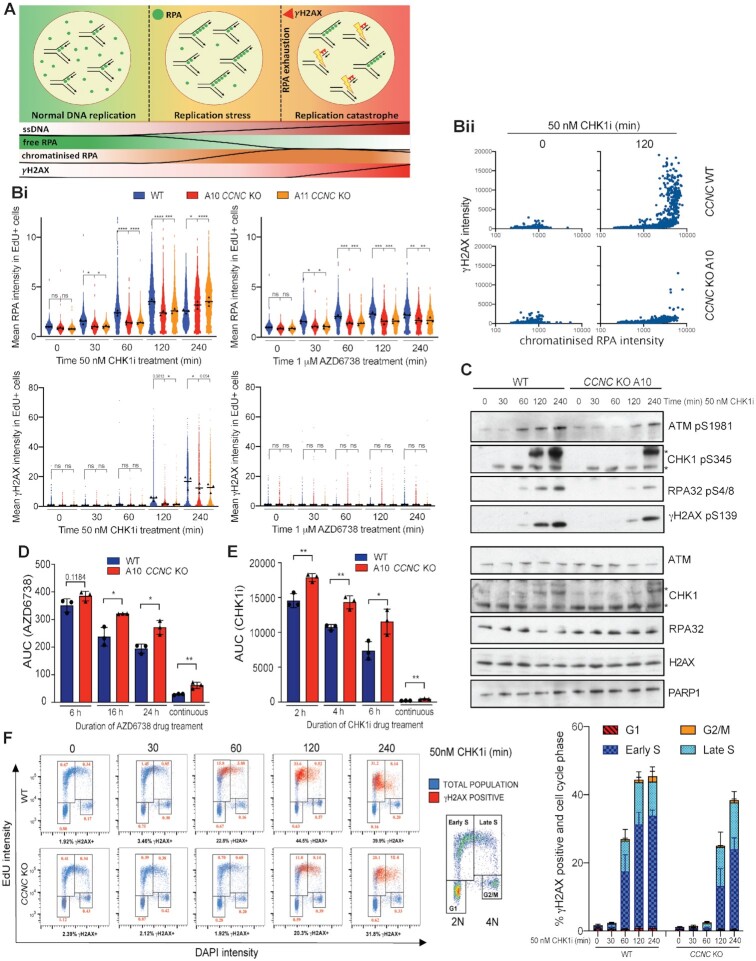
Figure 6.
Cyclin C loss supresses replication stress in response to ATRi and CHK1i. (A) Schematic of replication stress and replication catastrophe, which can be monitored by increased RPA32 chromatinisation (replication stress), followed by detection of γH2AX in RPA32 hyper-positive cells at later time points (replication catastrophe). (B) Chromatinised RPA32 and γH2AX intensities in EdU positive nuclei measured by immunofluorescence in CCNC WT and KO U2-OS cells. S-phase cells were labelled with 10 μM EdU for 30 min prior to pre-extraction and fixation. Representative images can be found in Supplementary Figure S8A. (i) Mean intensities normalised to non-treated WT cells, following 0–240 min treatment with 50 nM CHK1i (LY2603638) or 1 μM AZD6738 (biological n = 3). Mean intensities for each replicate are displayed as black triangles and were used for the overall mean calculations and statistical analyses. Mean intensities for each individual cell were normalised to the mean intensity of non-treated WT cells in each replicate, and all three replicates overlaid in blue (CCNC WT), red (CCNC KO A10) or orange (CCNC KO A11) for visualisation of single-cell data. These data are also normalized to the non-treated conditions of each individual cell line (Supplementary Figure S8B) to highlight that the suppression of replication stress upon ATRi/CHK1i in CCNC KO cells is independent of any differences in basal intensities. Statistical analyses were performed using one-way ANOVA analyses with multiple comparisons. P-values < 0.05 (*), 0.01 (**), 0.001 (***) and 0.0001 (****) were deemed statistically significant. ii) Representative example of replication catastrophe occurring in CCNC WT, but not KO, cells following 120 min CHK1i treatment. Mean chromatinised RPA32 and γH2AX intensities for each EdU-positive cell are presented as a scatter plot. (C) Immunoblots for markers of DSB formation, indicative of replication catastrophe. CCNC WT and KO U2-OS cells were treated for 0–240 min with 50 nM CHK1i (LY2603638) prior to lysis. *Both bands are modified forms of CHK1 as indicated by the shift in total protein. (D) Clonogenic survivals of CCNC WT and KO U2-OS cells treated with AZD6738 for 6, 16 or 24 h prior to drug wash-out, represented as AUCs. Error bars = mean ± SD (biological n = 3). Survival curves can be found in Supplementary Figure S8G. Statistical analyses were performed using a two-tailed unpaired Student's t-test. P-values < 0.05 (*), 0.01 (**), 0.001 (***) and 0.0001 (****) were deemed statistically significant. (E) Clonogenic survivals of CCNC WT and KO U2-OS cells treated with CHK1i LY2603638 for 2, 4 or 6 h prior to wash-out, represented as AUCs. Error bars = mean ± SD (biological n = 3). Survival curves can be found in Supplementary Figure S8H. Statistical analyses were performed using a two-tailed unpaired Student's t-test. P-values < 0.05 (*), 0.01 (**), 0.001 (***) and 0.0001 (****) were deemed statistically significant. (F) Representative FACS plots gated for cell-cycle phase using EdU versus DAPI intensity (blue), overlaid with γH2AX positive cells (red) after 0–240 min treatment of CCNC WT and KO U2-OS cells with 50 nM CHK1i (LY2603638). DNA content 2N = G1, 4N = G2/M. S-phase cells are EdU positive following 30 min treatment with 10 μM EdU, and are gated into early (2N–3N) or late (3N–4N) S-phase. Numbers in red indicate the % of the total population that are γH2AX positive and in the associated cell-cycle phase. A representative gating strategy for γH2AX positive cells is shown in Supplementary Figure S8I. Quantification of % cells that are γH2AX positive and in the associated cell-cycle phase in CCNC WT and KO cells following CHK1i treatment is also provided. Error bars = mean ± SD (biological n = 3).

