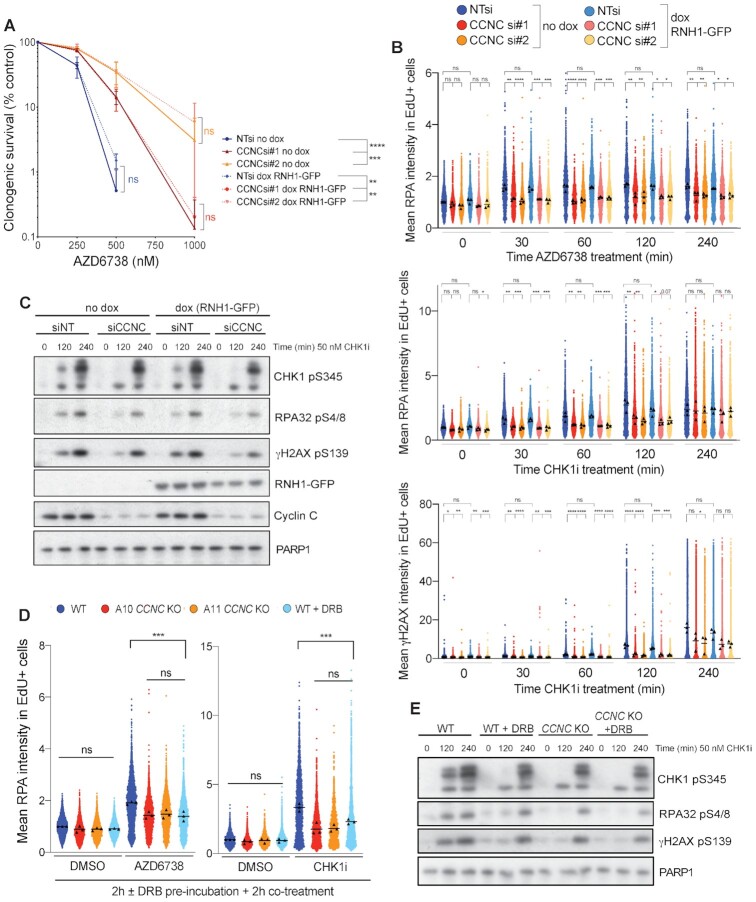
Figure 7.
Cyclin C-associated replication stress is transcription-dependent. (A) Clonogenic survivals of U2-OS cells ± Cyclin C depletion ± doxycycline induction of RNH1-GFP, treated with AZD6738. Error bars = mean ± SD (biological n = 3). Statistical analyses were performed using two-way ANOVA analyses. P-values < 0.05 (*), 0.01 (**), 0.001 (***) and 0.0001 (****) were deemed statistically significant. (B) Mean chromatinised RPA32 and γH2AX intensities in EdU positive nuclei measured by immunofluorescence in WT or Cyclin C-depleted U2-OS cells, ± doxycycline-induced RNH1-GFP expression, treated for 0–240 min with 50 nM CHK1i (LY2603638) or 1 μM AZD6738. S-phase cells were labelled with 10 μM EdU for 30 min prior to pre-extraction and fixation. Mean intensities for each replicate are displayed as black triangles and were used for the overall mean calculations and statistical analyses. Mean intensities for each individual cell were normalised to the mean intensity of non-targeted siNT cells in each replicate, and all three replicates overlaid for visualisation of single-cell data. Statistical analyses were performed using one-way ANOVA analyses with multiple comparisons. P-values < 0.05 (*), 0.01 (**), 0.001 (***) and 0.0001 (****) were deemed statistically significant. (C) Immunoblots for markers of DSB formation, indicative of replication catastrophe. U2-OS cells were siRNA-depleted of Cyclin C, or transfected with the control NT siRNA, and RNH1-GFP expression induced by the addition of doxycycline 24 h prior to treatment with 50 nM CHK1i (LY2603638) for 0, 2 or 4 h. CCNC siRNA #1 was used here, and the results obtained using siRNA #2 are provided in Supplementary Figure S9B. (D) Mean chromatinised RPA32 intensities in EdU positive nuclei measured by immunofluorescence in CCNC WT and KO U2-OS cells, normalised to non-treated WT cells (biological n = 3). Cells were pre-incubated with DMSO or 100 μM DRB for 2 h prior to 2 h co-treatment with DMSO, 1 μM AZD6738 or 50 nM CHK1i (LY2603638). S-phase cells were labeled with 10 μM EdU for 30 min prior to pre-extraction and fixation. Mean intensities for each replicate are displayed as black triangles and were used for the overall mean calculations and statistical analyses. Mean intensities for each individual cell were normalised to the mean intensity of non-treated WT cells in each replicate, and all three replicates overlaid for visualisation of single-cell data. Statistical analyses were performed using one-way ANOVA analyses with multiple comparisons. P-values < 0.05 (*), 0.01 (**), 0.001 (***) and 0.0001 (****) were deemed statistically significant. (E) Immunoblots for markers of DSB formation, indicative of replication catastrophe. CCNC WT and KO U2-OS cells were pre-incubated with 100 μM DRB for 2 h prior to co-treatment with 50 nM CHK1i (LY2603638) for the time-periods indicated. Control cells were treated with DMSO in parallel with the 4 h CHK1i incubation.

