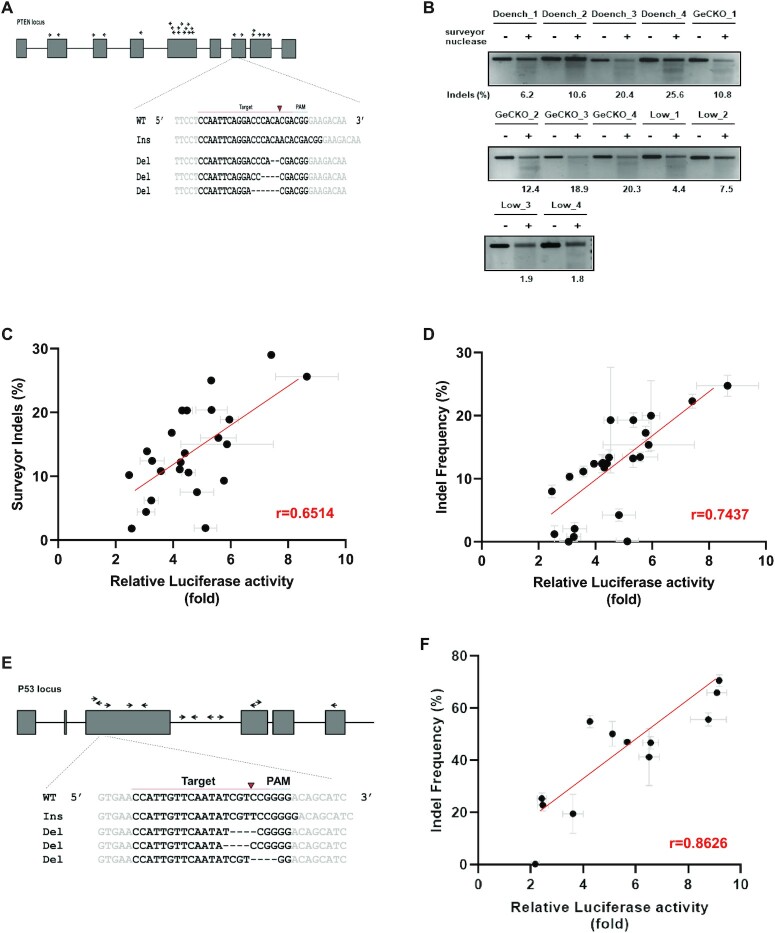
Figure 2.
Assessment of the cleavage efficiency of sgRNAs using the LacI-luciferase reporter. (A) Schematic of sgRNAs targeting the PTEN gene and representative deep sequencing data. The 12 sgRNAs for PTEN were designed to determine their cleavage efficiency using the LacI-luciferase reporter and indels using deep sequencing. Representative views of indels at the indicated loci are shown. Red arrowheads denote predicted Cas9 cutting sites. Black lines denote deletions and red letters denote insertions. (B) Representative images of the surveyor assay of 12 sgRNAs for PTEN. Indel frequencies of 24 sgRNAs were analyzed using a surveyor assay. The indel ratios were calculated based on band intensities. (C) Correlation between the LacI-luciferase reporter and surveyor assay data. The cleavage efficiency of 24 sgRNAs was measured using the LacI-luciferase reporter and the indel frequency was assessed using a surveyor assay (B). Correlation was calculated using Pearson's correlation coefficient, r = 0.6514, (n = 3) (D) Correlation between the LacI-luciferase reporter and deep sequencing data. For 24 sgRNAs, the cleavage efficiency was assessed using the LacI-luciferase reporter assay and the indel frequency was analyzed using deep sequencing. The correlation was calculated using Pearson's correlation coefficient, r = 0.7437, (n = 3; mean ± SD). (E) Schematic of sgRNAs targeting the TP53 gene and representative deep sequencing data. Twelve sgRNAs for the TP53 gene were designed to examine cleavage efficiency using the LacI-luciferase reporter assay and the indel frequency using deep sequencing. Representative views of indels at the indicated loci are shown. Red arrowheads denote the predicted Cas9 cutting sites. Black lines denote deletions and red letters denote insertions. (F) Correlation between the results of the LacI-luciferase assay and deep sequencing. For 12 sgRNAs, the cleavage efficiency was assessed using the LacI-luciferase reporter and the indel frequency was analyzed using deep sequencing. The correlation between the two methods was calculated using Pearson's correlation coefficient, r = 0.8626, (n = 3; mean ± SD).

