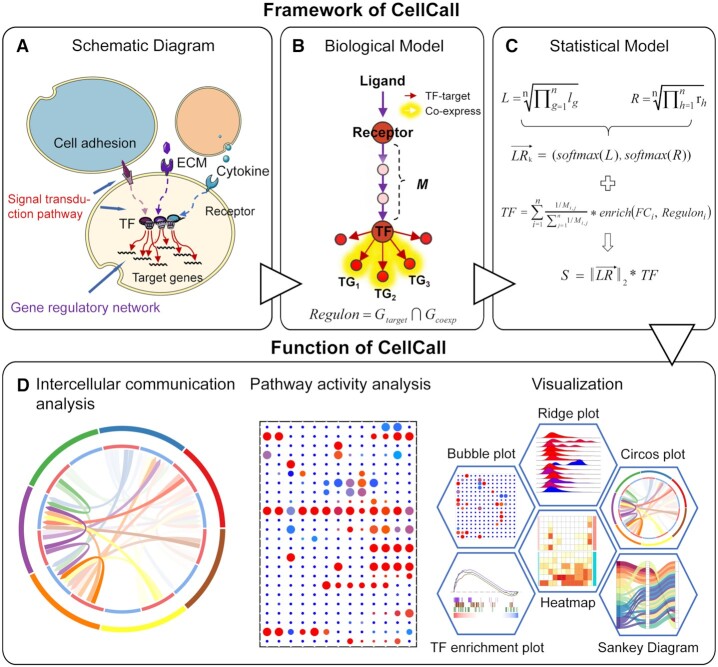
Figure 1.
Overview of CellCall. (A) The schematic diagram of intercellular communication. (B) The biological model of intercellular communication. (C) The statistical model of intercellular communication. (D) CellCall provides a variety of functions including intercellular communication analysis and pathway activity analysis and offers a rich suite of visualization tools to intuitively present the results of the analysis, including heatmap, Circos plot, bubble plot, Sankey plot, TF enrichment plot and ridge plot.

