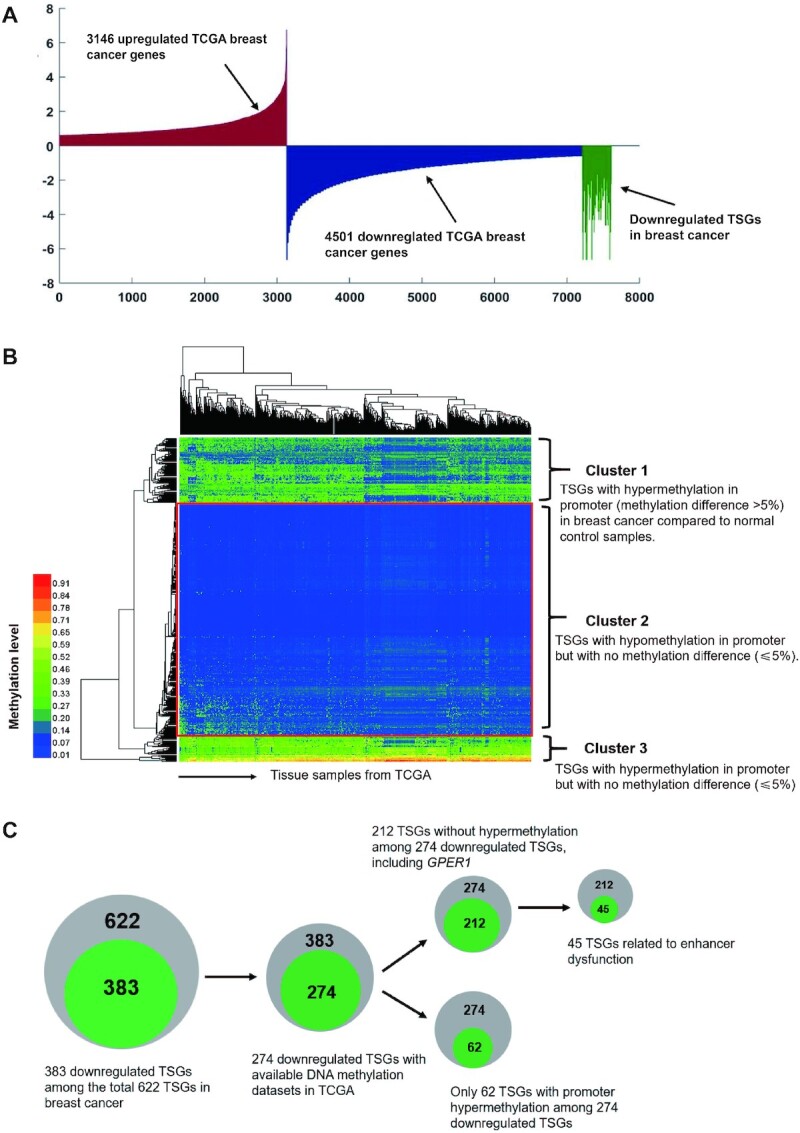
Figure 1.

Downregulated TSGs in breast cancer without promoter DNA hypermethylation. (A) 383 TSGs downregulated in breast cancer by analysis of all up-regulated (3146) or down-regulated (4501) genes in breast cancer samples compared to normal controls. (B) Heatmap of promoter methylation status of TSGs in 878 TCGA breast cancer samples. The different DNA methylation level within ± 5% was identified no difference. Cluster 1 represents 62 genes (about 22.6%) of the total downregulated TSGs are hypermethylated in promoter regions in breast cancer; Cluster 2, as seen in red box, representing 187 TSGs (about 68.2%) with hypomethylation but without methylation difference between breast cancer and normal controls; Cluster 3 represents 25 TSGs are DNA hypermethylated in promoter in both breast cancer and normal controls but without methylation difference (within 5%). (C) Schematic diagram for the profiling processes of TSGs. Among the total 622 TSGs in breast cancer in TCGA database, there are 383 downregulated TSGs. 274 TSGs with available methylation data are obtained in the 383 downregulated TSGs, in which 187 TSGs are DNA hypomethylated but with no methylation difference (within 5%). Among these 187 TSGs, there is a number of 45 genes, accounting for about 24.1%, of which the downregulation is related to enhancer alteration.
