Figure 3.
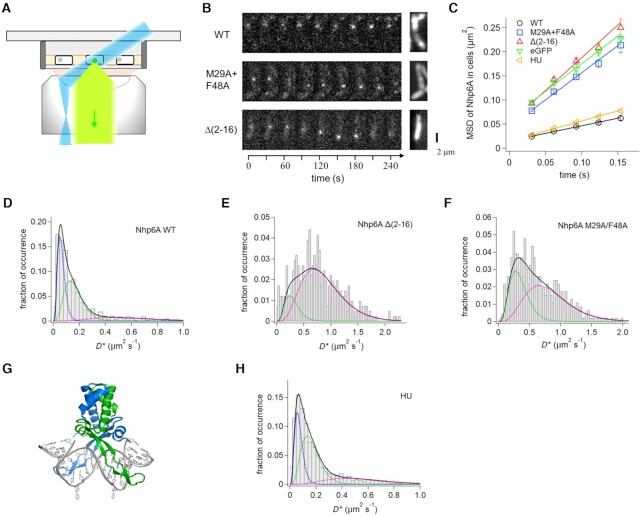
Single-molecule dynamics of Nhp6A and HU in growing cells. (A) Fluorescence imaging set-up of ADBPs fused with eGFP (green dot) in E. coli cells (white rectangle) on an agarose pad (gray shading) using HILO illumination (blue) and detection (light green). (B) Time courses of typical fluorescent images of single molecules of Nhp6A wild-type and mutants (white dots) (left) and images averaged over the time series (right). (C) Time course MSDs of Nhp6A mutants, HU, and eGFP. The error denotes the standard error of all pairs within a given interval. The solid lines represent the best fitted line with the slope of 4D. (D–F) Distributions of average diffusion coefficients of individual molecules of (D) Nhp6A-wt, (E) Δ(2–16) and (F) M29A + F48A. Black solid curves represent the best fitted curves by Equation (2) with two or three components. Colored dashed curves denote each of the two or three components. (G) Structure of the Anabaena HU dimer bound to DNA (PDB code: 1P78). The flipped-out bases stabilized the complex for crystallography (47). (H) Distributions of average diffusion coefficients of individual HU molecules.

