Figure 4.
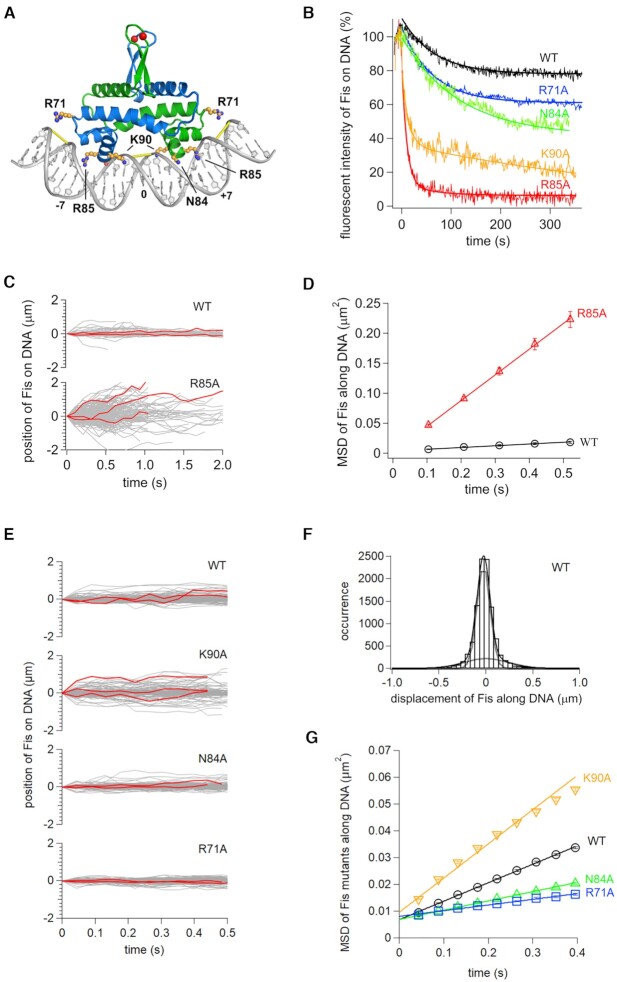
Role of Fis residues on DNA diffusion in vitro. (A) Structure of the Fis-DNA complex (based on PDB code 3IV5) highlighting side chains studied in this work. Red spheres denote labeling positions (Q21C), and yellow bars denote where the minor groove is narrowed to about half its canonical width. High affinity Fis binding motifs can be written as G(-7) - - - - wwwww - - - - C(+7) where w is A or T (bold w is numbered 0), and - indicates small or no base preferences except that A/T at -4 and T/A at + 4 are disfavored (see (55,137) for details). (B) Time courses of dissociation of Fis mutants from DNA in 100 mM Kglu. Solid curves are fitting curves by single or double exponentials. (C) Single-molecule traces of Fis-wt and Fis-R85A along DNA in 50 mM Kglu with example trajectories in red. (D) Time courses of MSDs along DNA for Fis-wt and Fis-R85A in 50 mM Kglu. The errors denote the standard error of all pairs within a given interval. The solid lines represent the best fitted line with the slope of 2D. (E) Single-molecule traces of Fis-wt, K90A, N84A and R71A along DNA in 150 mM Kglu. (F) Displacement distribution of Fis-wt along DNA in 176 ms intervals in 150 mM Kglu. Solid curves are the best fitted curves by double Gaussian functions (Equation 1). Dashed curves were the best fitted curves by each of the double Gaussian functions. (G) Time course plot of MSDs for Fis-wt, K90A, N84A and R71A molecules in 150 mM Kglu.

