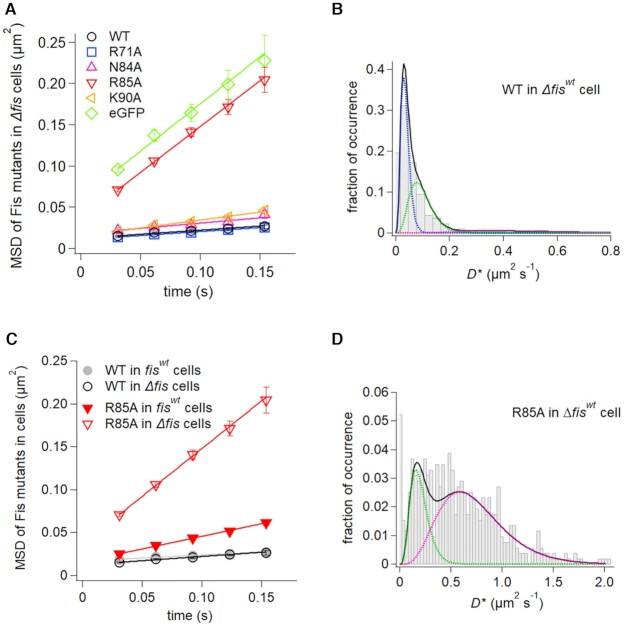
Figure 5.
In vivo dynamics of Fis mutants. (A) Time courses of MSDs of Fis mutants in Δfis cells. The errors denote the standard error of all pairs within a certain interval. The solid lines represent the best fitted lines with the slope of 4D. (B and D) Distributions of average diffusion coefficients of individual molecules of Fis-wt (B) and Fis-R85A (D) in Δfis cells. Black solid curves represent the best fitted curves by Equation (2) with two or three components. Colored dashed curves denote each of the two or three components. (C) Time courses of MSDs of Fis-wt and Fis-R85A in Δfis and fiswt cells. The solid lines represent the best fitted line with the slope of 4D.

