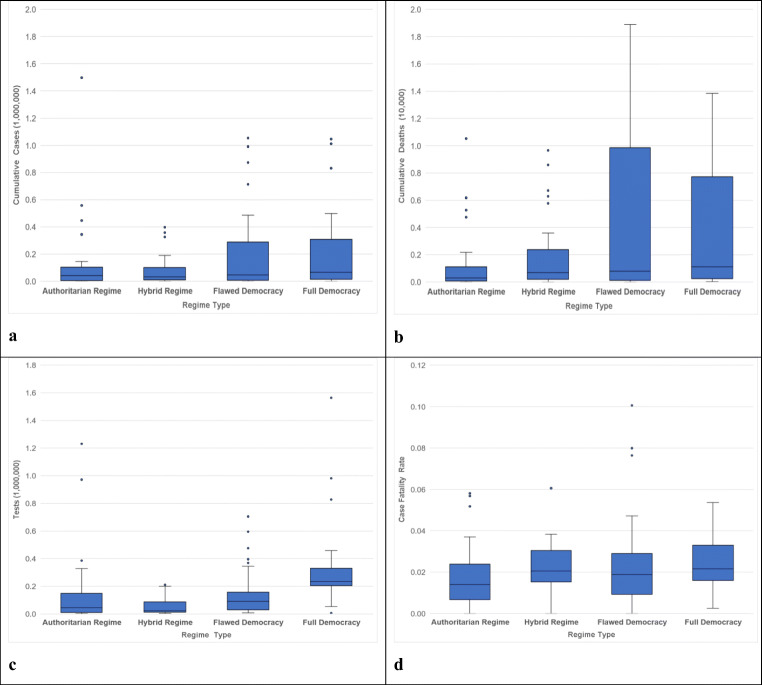
Fig. 1.
The cumulative confirmed cases and deaths of COVID-19, tests per 1,000,000 population, and case fatality rate distribution by regime type. The x-axis represents the four types of regimes in the order of “Authoritarian Regime,” “Hybrid Regime,” “Flawed Democracy,” and “Full Democracy.” Y-axis units are displayed in parentheses. a y-axis indicates the cumulative confirmed cases per 1,000,000 population. b y-axis indicates the cumulative deaths per 10,000 population. c y-axis indicates the tests per 1,000,000 population. d y-axis indicates the case fatality rate (%)

