Figure 5.
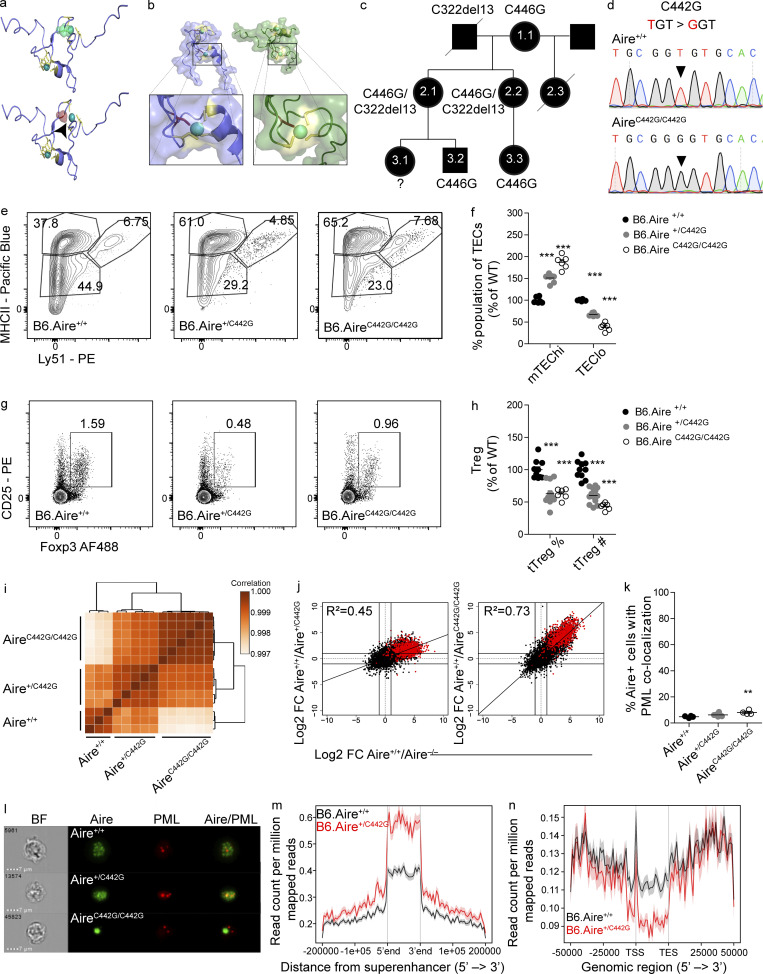
Identification of AIRE C446G as a novel dominant mutation located in the PHD2 domain. (a) The solution structure of the AIRE PHD2 domain (based on Gaetani et al., 2012), highlighting Zn2+-binding residues. Zn2+ shown as spheres and cysteines as sticks. The WT domain (top) with C446 (green) and C446G (red, bottom), demonstrating disrupted Zn2+ ligation of the C446G mutation also highlighted by a black arrowhead. (b) Solution structures of AIRE PHD1 (left, blue) and PHD2 (right, green) with the second Zn2+-binding region enlarged in each domain. Zn2+ shown as spheres and cysteines as yellow sticks; histidines in the first Zn2+-binding region are orange. The C311 and C446 residues (red), demonstrating their parallel position. (c) Family pedigree of individuals carrying an AIRE C446G mutation. Females are depicted as circles, males as squares. Diagonal lines indicate deceased individuals. (d) Chromatograms of DNA sequences around the C442G point mutation created. Nucleotide changes between the WT (top) and homozygous (bottom) sequence are highlighted by black triangles. (e) Representative flow cytometry plots of the TEC compartment of B6.Aire+/+, B6.Aire+/C442G, and B6.AireC442G/C442G mice. Numbers indicate the percentage of cells within each gate from the entire TEC compartment. (f) Frequencies of mTEChi (EpCAM+CD45−MHCIIhiLy51−/lo) and TEClo (EpCAM+CD45−MHCIIlo/midLy51−/lo) of B6.Aire+/+, B6.Aire+/C442G and B6.AireC442G/C442G mice. Frequencies are presented as the percentage from the average frequency of all WT animals within a given experiment. Data from two combined experiments with a total of five to eight mice per group are analyzed by one-way ANOVA and are represented as mean ± SEM. ***, P < 0.001 from the relevant WT littermate control. (g) Representative flow cytometry plots of T reg cells (CD4+CD8–CD25+Foxp3+) from thymi of B6.Aire+/+, B6.Aire+/C442G, and B6.AireC442G/C442G mice. Numbers indicate the percentage of cells within the gate from the CD4+ single-positive population. (h) Frequency and absolute counts of T reg cells (CD4+CD8–CD25+Foxp3+) in the thymi of B6.Aire+/+, B6.Aire+/C442G and B6.AireC442G/C442G mice. Both frequencies and absolute counts are presented as a percentage from the average frequency or count of all WT animals within a given experiment. Data from three combined experiments with a total of 6–12 mice per group are analyzed by one-way ANOVA and are represented as mean ± SEM. ***, P < 0.001 from the relevant WT littermate control. tTreg, thymic T reg. (i) Dendrogram and heatmap of Pearson correlation coefficient between the different mTEChi bulk RNAseq samples based on total gene expression values. (j) FC/FC plots of mTEChi gene expression comparing B6.Aire+/+/B6.Aire+/C442G (left, y axis) to B6.Aire+/+/B6.Aire−/− (x axis), or B6.Aire+/+/B6.AireC442G/C442G (right, y axis) to B6.Aire+/+/B6.Aire−/− (x axis). All genes are depicted by black dots along with a trendline for the best linear fit, and R2 is indicated in each plot. A signature of Aire-dependent TRA genes, which are down-regulated by at least 10-fold in B6.Aire−/− (based on a dataset from Sansom et al., 2014), is superimposed using red dots. (k) Frequency of AIRE+ mTEChi with significant colocalization (i.e., bright detail similarity >1.5) of AIRE and PML in B6.Aire+/+, B6.Aire+/C442G, and B6.AireC442G/C442G littermate mice. Data from four to six mice per group from two independent experiments, analyzed by one-way ANOVA, are represented as mean ± SEM. **, P = 0.0089 from the relevant WT littermate control. (l) Representative ImageStream snapshots of AIRE and PML colocalization in B6.Aire+/+, B6.Aire+/C442G, and B6.AireC442G/C442G littermate mice. BF, bright field. (m and n) Histogram for ChIPseq tag density for AIRE in B6.Aire+/+ and B6.Aire+/C442G mTEChi superenhancer regions defined in Bansal et al. (2017) (m) and AIRE-dependent TRA genes (n; as in j). TSS, transcription start site; TES, transcription end site.

