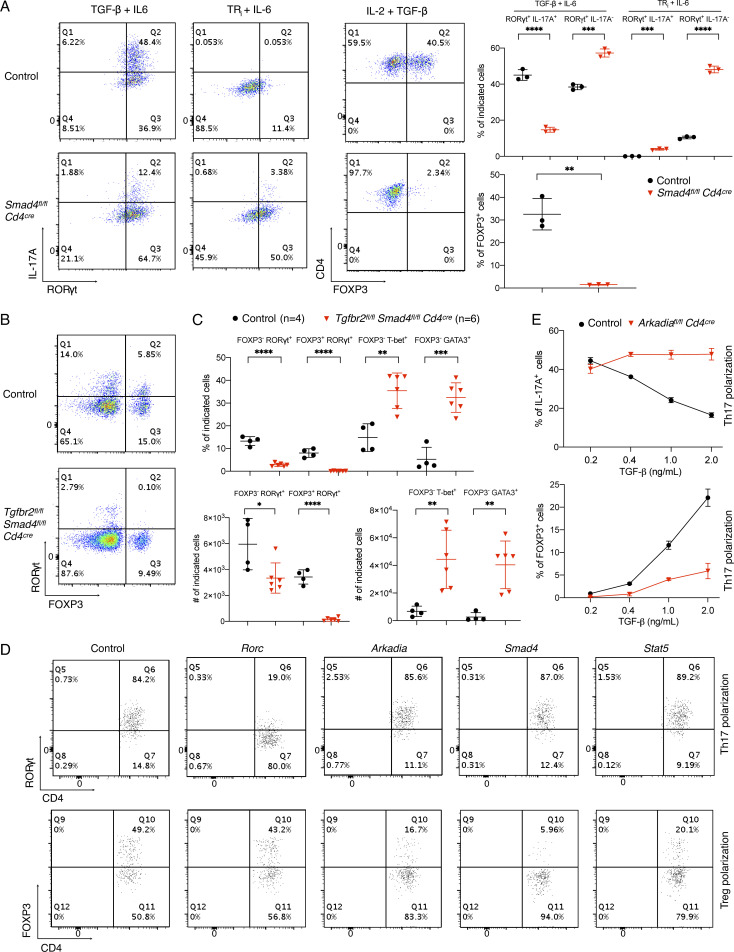
Figure S1.
Differential requirement of components of TGF-β signaling pathway in Treg and Th17 cell differentiation, related to Fig. 1. (A) Role of SMAD4 in Th17 and Treg cell differentiation. Left: Representative flow cytometry panels of T cells from control littermates and conditional Smad4 mutant mice, differentiated in vitro under Th17 and Treg cell conditions, or with blockade of TGF-β signaling with TRi (SB525334), an inhibitor of TGF-βR1. Right: Representative data of two independent experiments of T cells differentiated under the indicated conditions. Black circle, control T cells; red triangle, SMAD4-deficient T cells. P values were calculated by unpaired t test. **, P < 0.01; ***, P < 0.001; ****, P < 0.0001. (B) Representative RORγt and FOXP3 staining of CD4+ TCRβ+ T lymphocytes from LILP of control littermates (with at least one allele expressing intact SMAD4 and TGF-βR2) and Tgfbr2fl/fl Smad4fl/fl Cd4cre conditional DKO mice (4–6 wk old) kept under SPF conditions. (C) Proportion and total cell number of indicated T cell populations in the LILP from control (black circle) and Tgfbr2fl/fl Smad4fl/fl Cd4cre mice (red triangle), as shown in B. Data in B and C were combined from two independent experiments. Differences were determined by unpaired t test. *, P < 0.05; **, P < 0.01; ***, P < 0.001; ****, P < 0.0001. (D) Flow cytometry analysis of CD4+ T cells differentiated in vitro under Th17 and Treg conditions following transduction of retroviruses expressing the indicated gRNAs. Naive T cells were from Cas9 transgenic mice, and analysis was performed following gating on the Thy1.1 transduction marker. (E) Flow cytometry to assess percentage of IL-17A (top graph) and FOXP3 (bottom graph) expressing T cells from control littermates (black circle) and Arkadiaf/f Cd4Cre mice (red triangle) polarized in the presence of different concentration of TGF-β plus 20 ng/ml IL-6. Data in D and E are representative of three independent experiments. All error bars represent SD (A, C, and E).

