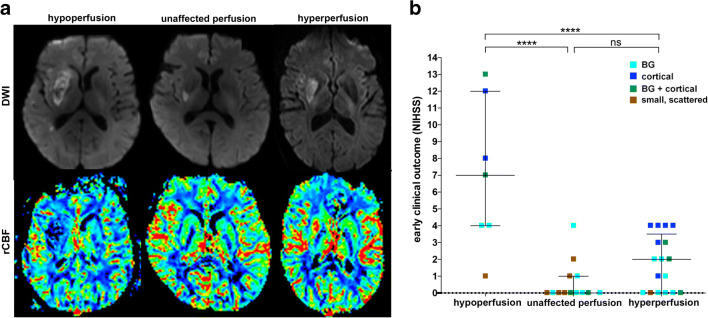
Fig. 1.
Perfusion signatures illustrated in basal ganglia infarcts. Three representative diffusion-weighted images and corresponding CBF maps are displayed. (a) All three patients show BG infarcts, but different perfusion signatures with hypoperfusion (1st column), unaffected perfusion (2nd column), and hyperperfusion (3rd column). Early clinical outcome (as indicated by NIHSS at discharge from our institute) was worse in patients with hypoperfusion compared to patients with unaffected perfusion or hyperperfusion (b)

