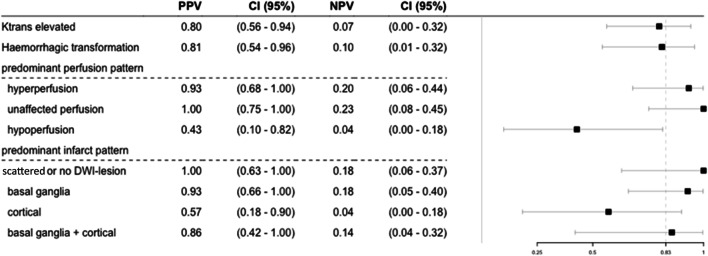
Fig. 4.
Clinical outcome at 3 months. Positive predictive values (PPV), negative predictive values (NPV), and their confidence intervals for a favorable clinical outcome 3 months after stroke (mRS90 < 3 or mRS90 = pre-stroke mRS = 3). The vertical line within the forest plot indicates the pre-test probability for a favorable clinical outcome in our cohort (0.83). BBBD (as indicated by elevated ktrans) was observed in patients with favorable and in patients with unfavorable clinical outcome. Moreover, it was also observed in both hyperperfusion and (in all cases of) hypoperfusion, with only the latter being associated with poorer clinical outcome at 3 months

