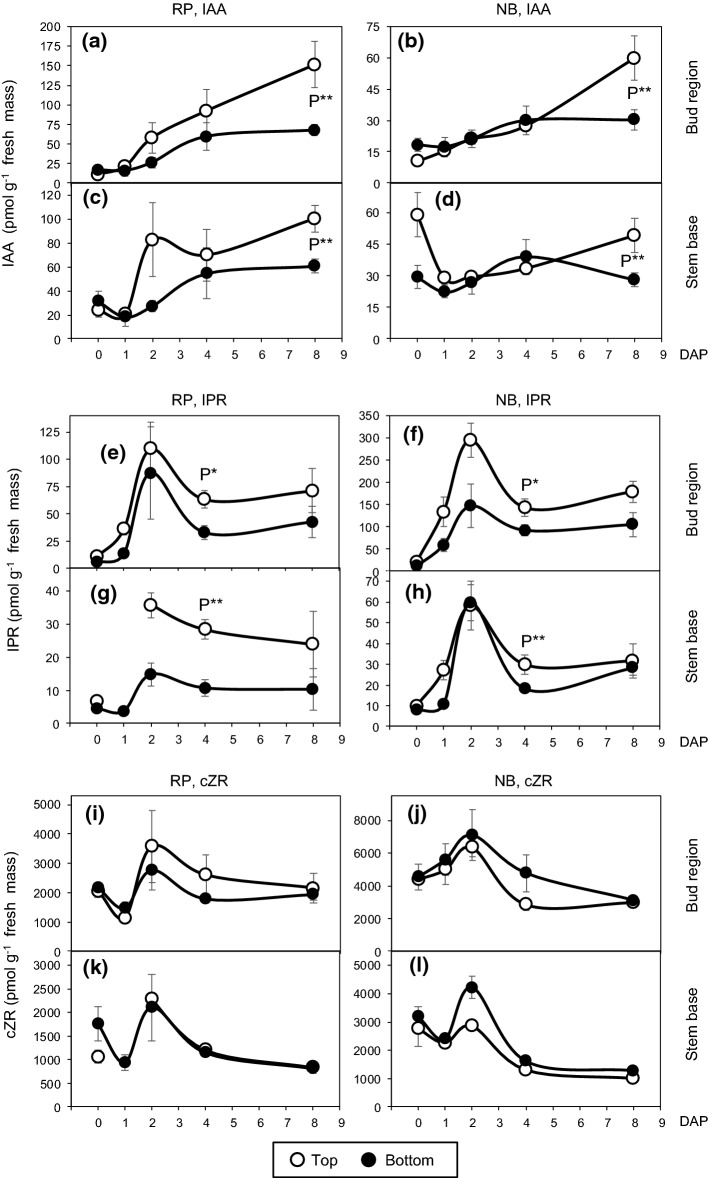
Fig. 4.
Temporal distribution of indole-3-acetic acid (IAA, a–d), isopentenyladenosine (IPR, e–h) and cis-zeatin riboside (cZR, i–l) in the bud region (a, b, e, f, i, j) and the stem base (c, d, g, h, k, l) of rose cuttings of the cultivars ‘Rosa progress’ (RP) and ‘Natal briar’ (NB) as affected by the cutting position (top, bottom). Mean values ± SE (n = 4, each consisting of tissue from five cuttings). Curve fit of CK levels in the stem base of top RP cuttings interrupted because no data exist for 1 DAP. P*, P** significant effect of cutting position independent on cultivar at the specific DAP at P ≤ 0.05, 0.01, respectively

