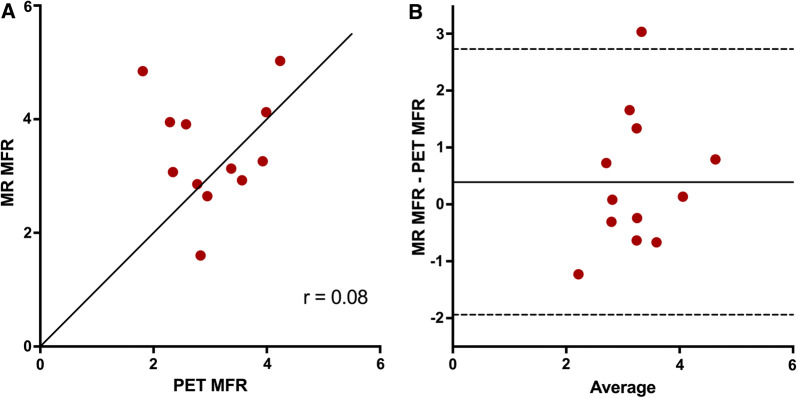
Figure 6.
Correlation (A) and agreement (B) of MR-based global MFR vs PET-based global MFR. The solid line in a is line of identity. The solid line in B indicates the mean difference (bias), whereas the dashed lines show the limits of agreement. Bias (limits of agreement) in b are 0.39 (− 1.94 to 2.73)

