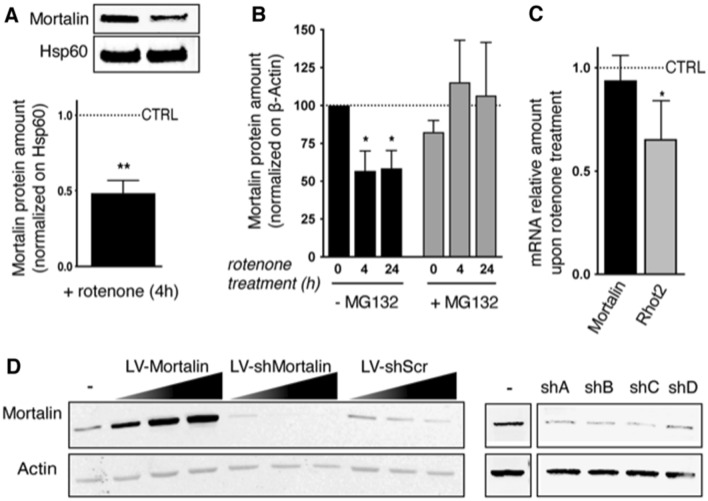
Figure 1.
Modulation of Mortalin levels in primary cultured neurons. (A) Mortalin is down-regulated in neurons upon treatment with rotenone. Rat embryonic primary cortical neurons (DIV 12) were treated or not with 10 nM rotenone (+ rotenone) for 4 h and protein extracts were prepared from mitochondria-enriched fractions. Mortalin amounts were assessed by Western blot, using the mitochondrial chaperone Hsp60 or ß-Actin as loading controls. The graph represents the normalized ratio relative to untreated neurons and is expressed as the mean ± SD of 4 independent experiments. (B) Mortalin loss upon rotenone treatment is due to proteasomal degradation. Neurons (DIV 12) were treated or not with 10 nM rotenone for 4 or 24 h with or without MG132. Neuronal extracts were then analyzed by Western blotting for Mortalin protein quantification. ß-Actin was used as a loading control. The graph represents means ± SD of Mortalin amounts in treated neurons, normalized on control, untreated ones (100%), in 3 independent experiments. (C) Mortalin RNA levels are not affected by rotenone treatment. RNA was extracted from neurons treated or not with 10 nM rotenone for 4 h. qRT-PCR experiments were performed to determine mRNA levels for Mortalin and Rhot2 (Miro2 gene), as well as for Mdh1, a housekeeping gene. The ratios of Mortalin and Rhot2 mRNA levels (normalized on Mdh1) in rotenone treated vs. untreated neurons were calculated and data are presented as means ± SD of 4 independent experiments. (D) Modulation of Mortalin expression by transduction with lentiviral vectors (LV). Overexpression was achieved with a LV bearing an expression cassette for the rat Mortalin gene. Mortalin down-regulation was driven by cell transduction with lentiviral vectors (numbered sh A to D) expressing a set of specific 29-mer shRNA directed against Mortalin (shMortalin), or a control scramble sequence (shScr, Origene TR704140). Different multiplicities of transduction (1, 2, 4) were used to test the percentage of over- or under-expression. WB are presented as cropped parts of full blots displayed as supplemental information. DIV: days in vitro. *: p < 0.05, **p < 0.01, by Mann–Whitney non parametric t-test.

