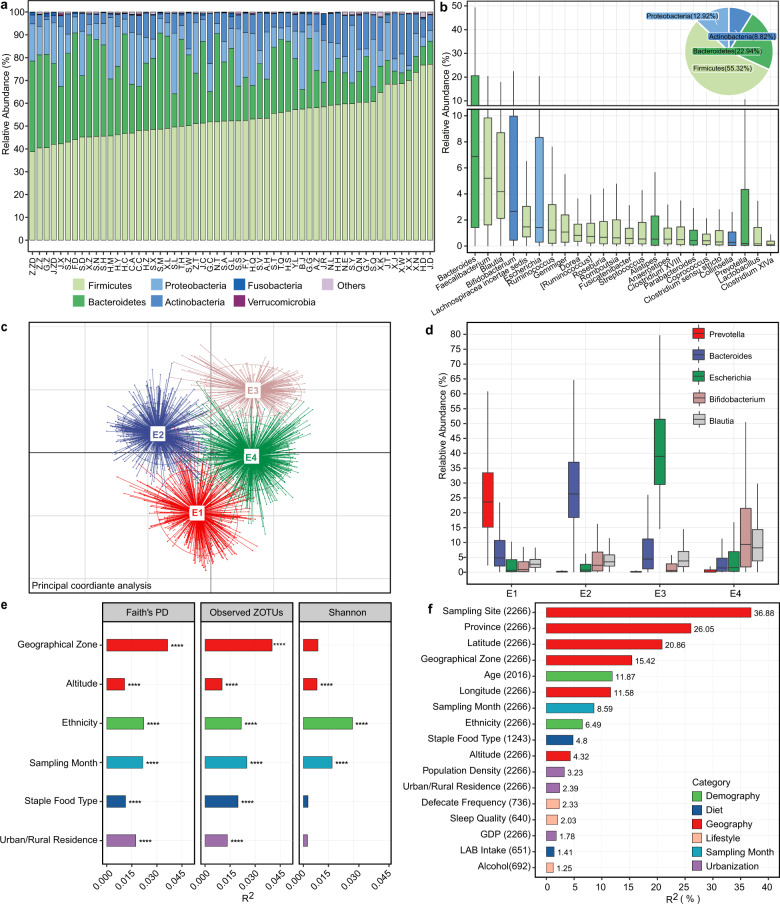
Fig. 2. The gut microbiota composition of the Chinese population and associated covariates.
a Relative abundances of the top six phyla at each sampling site. b Relative abundances of the 24 core genera, which presented in >90% of individuals with an average relative abundance >0.1%. The pie chart shows the phylum-level microbial composition of the cohort. LAB: lactic acid bacteria. c PCoA plot showing four enterotypes. d Relative abundances of representative genera of enterotypes. e Covariates associated with microbiota alpha diversity. Covariates having adjusted R2 > 0.01 and ****p < 0.0001 (simple linear regression) with at least one alpha index were shown. f Covariates associated with microbiota beta diversity estimated by JSD distance. The effect size was calculated with envfit (vegan), and covariates with p.adj < 0.05 were shown. The number of samples was indicated in brackets following each covariate. In boxplots, the center line represents the median, box limits represent upper and lower quartiles and whiskers represent 1.5× interquartile range. See also Figure S2.

