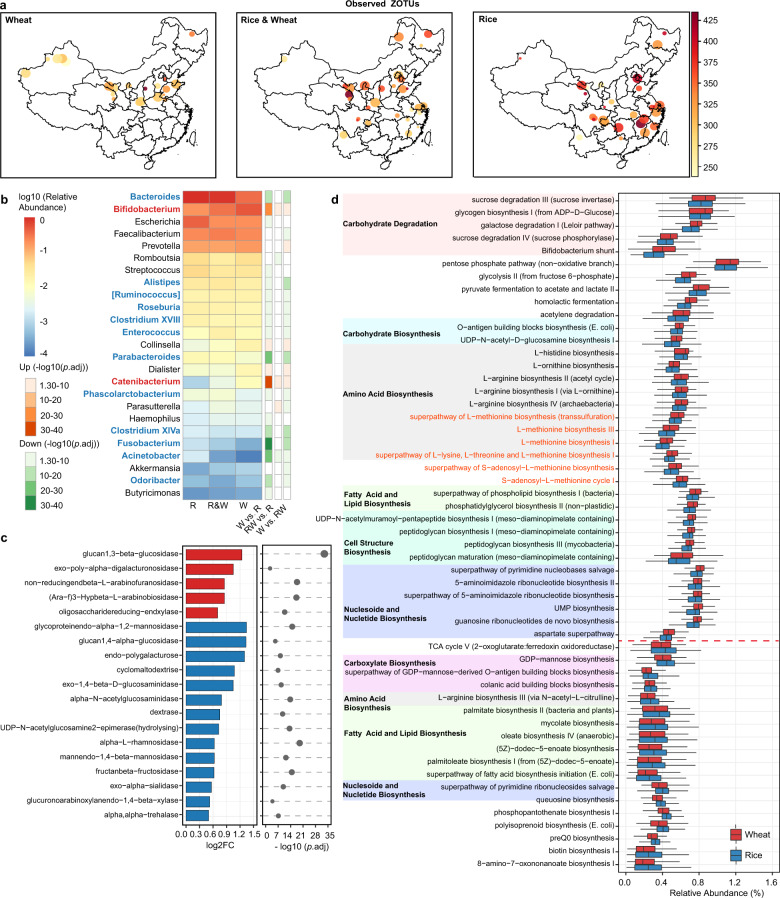
Fig. 3. Differences in the microbiota alpha diversity, composition, and functional potential between populations consuming different staple food.
a Observed ZOTUs. Each dot represents a sampling site; the color of the dot indicates the median value in each site; the diameter of the dot is proportional to the number of samples in each site and is fixed for sites with >15 samples. b Differential genera between the three groups. Genera with p.adj <0.05 from DESeq2 analyses were shown. Genera highlighted in red or blue indicate higher abundances associated with wheat or rice intake, which were detected with two DESeq2 models. R rice, W wheat. c Differential glycosidase between the Rice and Wheat group. Glycosidase with log2FC > 0.5 and p.adj < 0.05 from Mann–Whitney tests were shown. d Differential pathways between the Rice and Wheat group. Pathways were grouped by the functional category, and those with higher abundance in the Wheat group were placed on the upper part of the plot. Pathways related to l-methionine and S-adenosyl-l-methionine biosynthesis were highlighted in red. Pathways with log2FC > 0.1 and p.adj < 1e-10 from Mann–Whitney tests were shown. In boxplots, the center line represents the median, box limits represent upper and lower quartiles and whiskers represent 1.5× interquartile range. Rice: n = 417, Wheat: n = 549, Rice & Wheat: n = 277. See also Figure S3.

