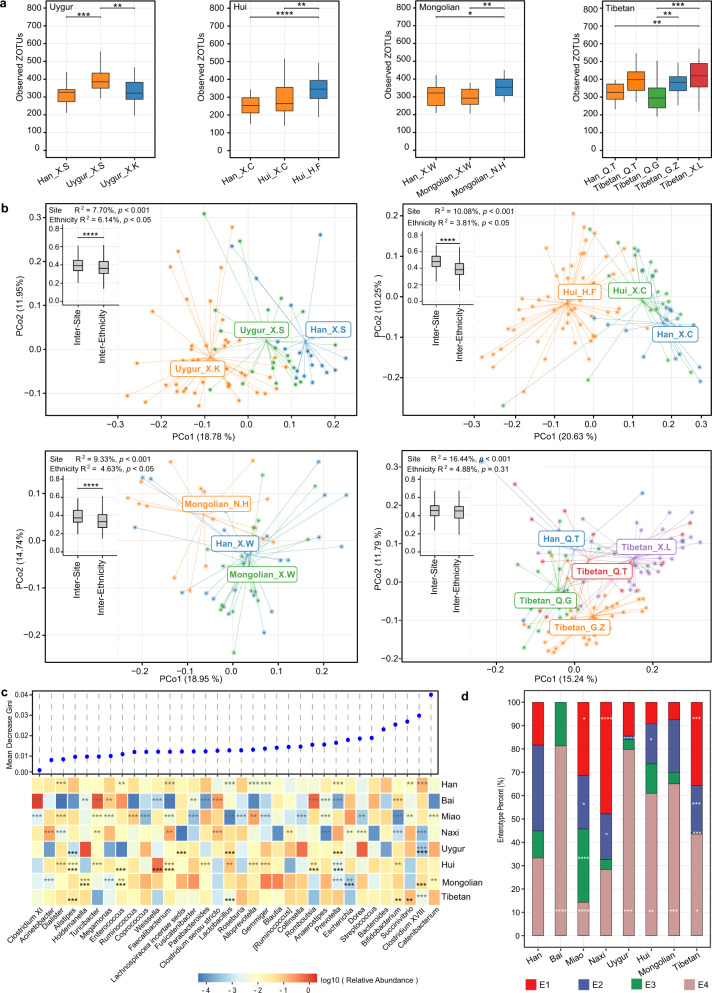
Fig. 4. Gut microbiota characteristics of different ethnic groups.
a Observed ZOTUs of different ethnic groups per sampling site. The labels of x axis indicate ethnic groups followed by sampling sites. *p.adj < 0.05, **p.adj < 0.01, ***p.adj < 0.001, Mann–Whitney test. b PCoA plot based on JSD. Inserted boxplots show the inter-site distance for samples belonging to the same ethnic groups, and inter-ethnicity distance for samples from the same sampling sites; ****p < 0.0001, Mann–Whitney test. Corresponding R2 and p values from PERMANOVA tests were also shown. c Differences in the abundances of predominant genera between ethnicity groups. Genera were ordered by mean decrease in Gini from random forest models classifying ethnic groups. Genera with average relative abundance >1% and presence in >50% of the samples in at least one ethnic group were shown. Asterisks represent p.adj values from DEseq2 models; the gray ones indicate comparisons between one ethnic group and the rest groups (and adjusted for sampling sites), while the black ones indicate comparisons between each of the ethnic minority groups (Hui, Mongolian, Tibetan, and Uygur) and their accompanying Han samples from the same sampling sites; **p.adj < 0.01, ***p.adj < 0.001. d Percentage of enterotypes in each ethnic group. *p < 0.05, **p < 0.01, ***p < 0.001, Fisher’s exact test comparing ethnicity minority groups to Han. In boxplots, the center line represents the median, box limits represent upper and lower quartiles and whiskers represent 1.5× interquartile range. c–d Han: n = 1755, Bai: n = 16, Miao: n = 70, Naxi_ n = 46, Uygur: n = 69, Hui: n = 87, Mongolian: n = 40, Tibetan: n = 154. See also Figure S4.

