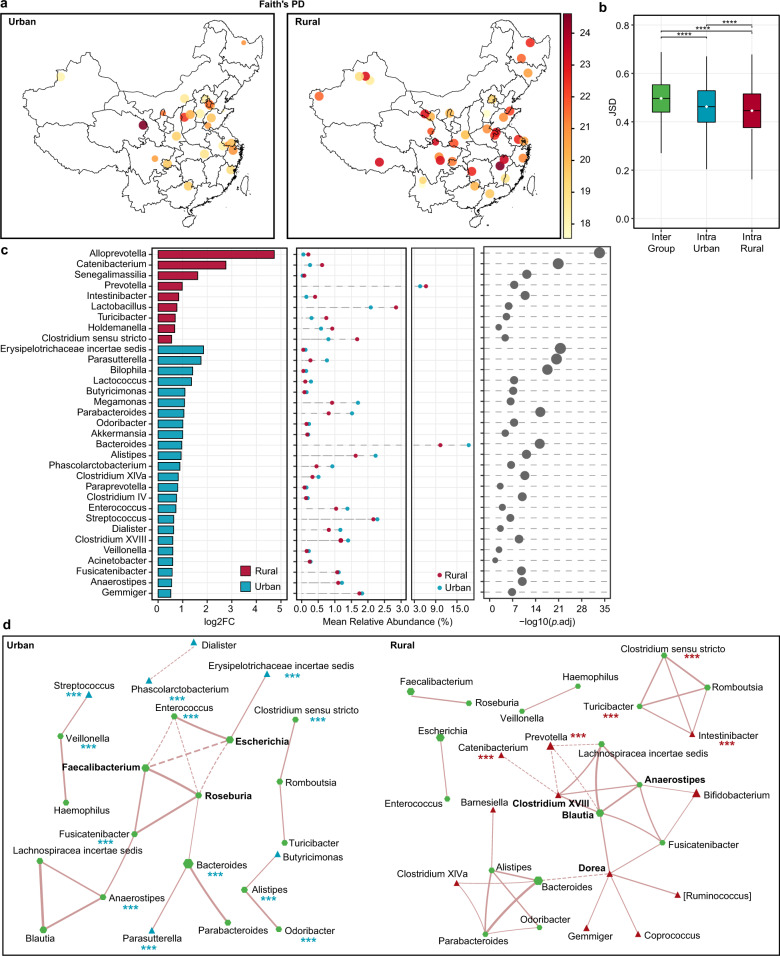
Fig. 5. Differences in the microbiota diversity, composition, and network between urban and rural populations.
a Faith’s PD. Each dot represents a sampling site; the color of the dot indicates the median value in each site; the diameter of the dot is proportional to the number of samples in each site and is fixed for sites with more than 15 samples. b Inter- and intra-group JSD. The intra-group distance was calculated per sampling site. ****p < 0.0001, Mann–Whitney test. The center line of the boxplot represents the median, box limits represent upper and lower quartiles and whiskers represent 1.5× interquartile range. c Differential genera were detected with the DESeq2 model. Genera with p.adj < 0.05 were shown. d Co-occurrence network of genera. SparCC correlations with r > 0.35 and p < 0.01 were shown. Each node represents a genus; the size of the node is proportional to the median relative abundance of the corresponding genus; the green, red, and blue colors represent the shared genus, rural-specific genus, and urban-specific genus, respectively. The solid and dotted lines represent positive and negative correlations, respectively, and the thickness of the edge is proportional to the r value. Red and blue asterisks indicate differential genera shown in c, ***p.adj < 0.001. Urban: n = 637, rural: n = 1530. See also Figure S5.

