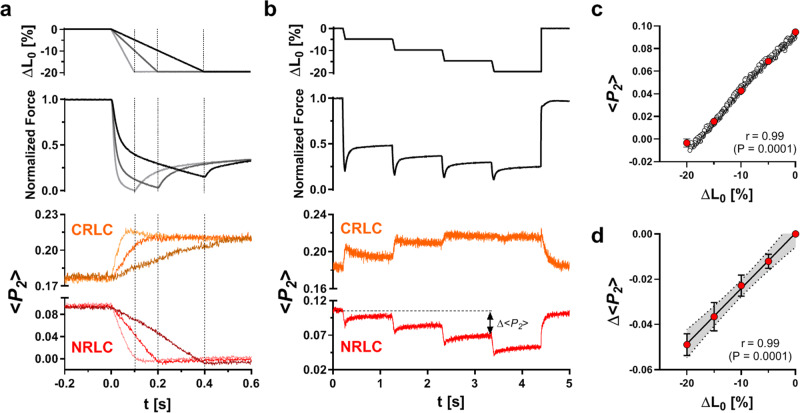
Fig. 4. Orientation changes of the NRLC and CRLC probe in response to ramp and staircase shortening.
a NRLC (red) and CRLC probe orientation (orange) during ramp shortening of ventricular trabeculae at different velocities (2 L0/s, light grey; 1 L0/s, dark grey; 0.5 L0/s, black). b Staircase ramp release protocol. Top: muscle length. Middle: force response during the mechanical protocol. Bottom: <P2> for the NRLC (red) and CRLC probe (orange). c Length-dependence of <P2> from the NRLC probe during ramp shortening (pooled data from a shown as open circles). Average <P2> at 0%, 5%, 10%, 15% and 20% shortening over all ramp shortening velocities is shown as red circles (n = 3 trabeculae). The Pearson correlation coefficient (r) is shown on the bottom right. Statistical significance was assessed with a two-tailed student’s t test. d Plot of <P2> change (Δ<P2>) for the NRLC probe in the staircase protocol versus muscle length change (n = 4 trabeculae). The Pearson correlation coefficient (r) is shown on the bottom right. Statistical significance was assessed with a two-tailed student’s t test. Data are shown as means ± s.e.m. Source data are provided as a Source Data file.

