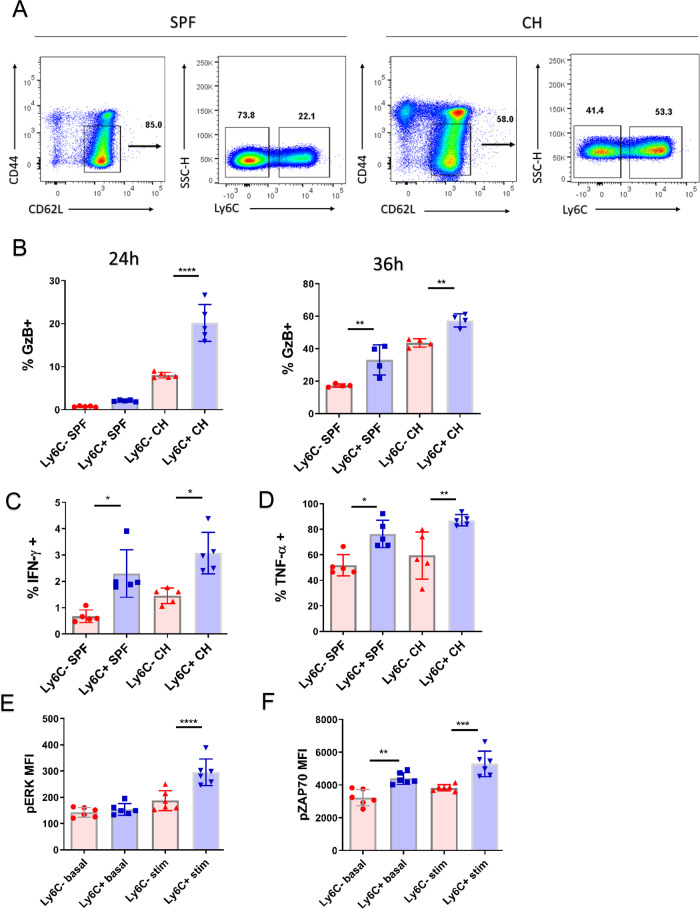
Fig. 3. Ly6C+ CD8+ Tn cells display rapid and enhanced effector function in vitro.
A CD8 T cells were enriched by magnetic sorting from secondary lymphoid tissues (spleen and pool of brachial, inguinal, and cervical lymph nodes) of SPF and CH mice. Ly6C+ and Ly6C− CD44loCD62Lhi cells were then sorted by flow cytometric sorting. Forty thousand sorted cells were plated in round-bottom plates and simulated α-CD3/α-CD28 beads in 1:1 cell to bead ratio for 24 h or 36 h and with phorbol-myristate acetate (PMA) and ionomycin for 6 h in presence of brefeldin A. B Expression of GzB was measured on live cells by intracellular flow cytometric staining following 24 h (left panel, n = 5 mice per group, data presented as mean ± sd, left to right **p = 0.0021, **p = 0.0055) or 36 h stimulation with α-CD3/α-CD28 beads (right panel, n = 4 mice per group, data presented as mean ± sd) (C) IFN-γ expression was measured on live cells by intracellular flow cytometric staining (n = 5 mice per group, data presented as mean ± sd, left to right *p = 0.0184, *p = 0.0479), as well as expression of (D) TNF-α. (n = 5 mice per group, data presented as mean ± sd, *p = 0.0131, **p = 0.0055). E Phosphorylation of Erk (p-Erk) was measured by phosflow on unstimulated sorted cells or stimulated for 20 min with an α-CD3/α-CD28 bead (n = 6 mice, data presented as mean ± sd, ****p < 0.0001), as well as (F) phosphorylation of ZAP-70 Y319 (n = 6 mice, data presented as mean ± sd, **p = 0.0014, ***p < 0.001). A, C, D Data are representative of two experiments (with n = 5 mice per group). E, F Data are representative of two experiments (with n = 6 mice) (*p < 0.05, **p < 0.01, ***p < 0.001, ****p < 0.0001). A, B, D, E, F one-way ANOVA with Sidak post-hoc correction for multiple comparisons: C-one way Kruskal-Wallis test with Dunn’s correction for multiple comparisons.

