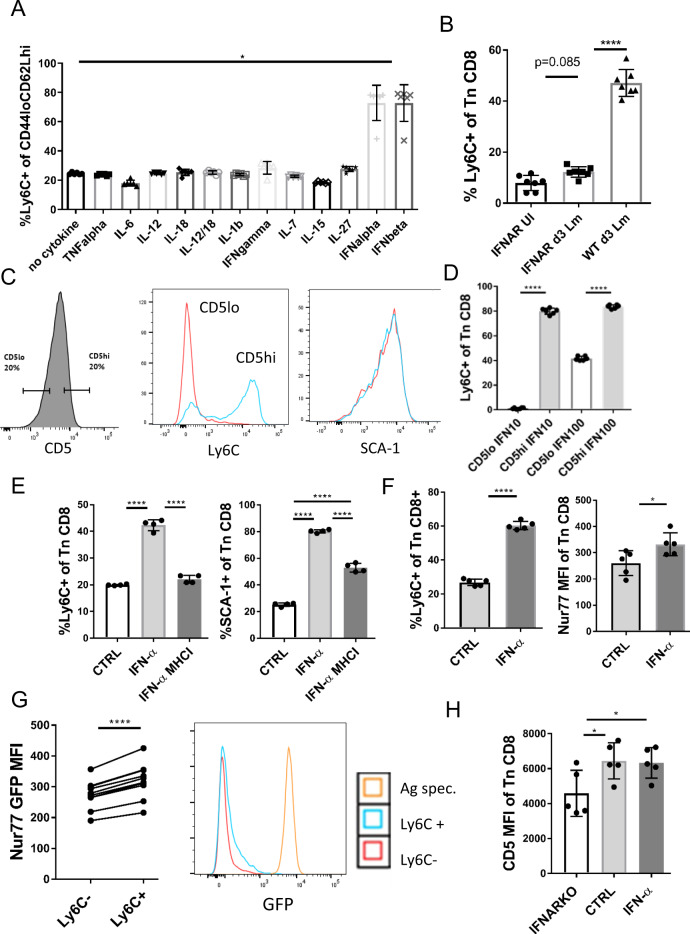
Fig. 6. Ly6C upregulation is a direct consequence of IFN-I and tonic TCR signaling.
A CD62LhiCD44lo CD8+ T cells were magnetically enriched from pooled secondary lymphoid tissues (spleen, brachial and inguinal lymph nodes) to >95% purity. Cells were then cultured in RPMI media + 10% FCS and 100 ng/ml of each cytokine TNF-α, IFN-γ, IL-12, IL-18, IL-7, IL-15, IL-6, IFN-α, and IFN-β. Twenty-four hours later expression of Ly6C was measured (n = 6 mice, data presented as mean ± sd, p = 0.0237) B Ifnar1−/− mice were infected i.v. with 104 CFU Lm. Expression of Ly6C on Tn CD8+ cells was measured in Lm infected Ifnar1−/− mice (72 h p.i.), uninfected Ifnar1−/− mice, and wt Lm infected mice (n = 7 mice per group, data presented as mean ± sd, ****p < 0.0001). C Top and bottom 20% of CD8+ Tn cells by CD5 MFI were FACS sorted (Color scheme: red-CD5lo; blue-CD5hi) and (D) cultured in RPMI media + 10% FCS and 10 or 100 ng/ml IFN-α. After 24 h expression of Ly6C and SCA-1 were measured by flow cytometry (n = 6 mice per group, data presented as mean ± sd, ****p < 0.0001). E CD8+ Tn cells were magnetically enriched to >95% purity and stimulated with 100 ng/ml IFN-α.± MHCI blocking antibody (clone 28-8-6) for 24 h (n = 4 mice, mean ± sd). F Nur77GFP mice (n = 5) were treated with 0.75 µg/mouse of IFN-α. 48 h post-treatment mice were bled retroorbitally and expression of GFP and Ly6C was measured on CD8+ Tn cells (n = 5 mice per group, data presented as mean ± sd, ****p < 0.0001). G Left panel expression of GFP was compared between Ly6C+ and Ly6C− subpopulations of Tn CD8+ cells (n = 10 mice, data presented as individual dots and paired t-test lines, *p = 0.0363, ****p < 0.0001); right panel GFP histograms of Ly6C ± Tn CD8+ cells were overlayed with GFP histogram of antigen (SIINFEKL peptide, 10−7 M) stimulated OT-1 Nur77GFP (Color scheme:red-Ly6C−; blue-Ly6C+, orange-antigen (SIINFEKL peptide) specific). H Ifnar1−/− mice, wt mice, and IFN-α treated mice were bled and CD5 MFI was measured on CD8 + Tn cells. (n = 5 mice per group, data presented as mean ± sd, left to right *p = 0.0362, *p = 0.0480). A, B Data are pooled from two experiments, C–G Data are representative of two independent experiments (*p < 0.05, **p < 0.01, ***p < 0.001, ****p < 0.0001). A one-way Kruskal-Wallis test with Dunn’s correction for multiple comparisons, B, D, E, H one-way ANOVA with Sidak post hoc correction, F, G two-tailed Student’s t-test.

