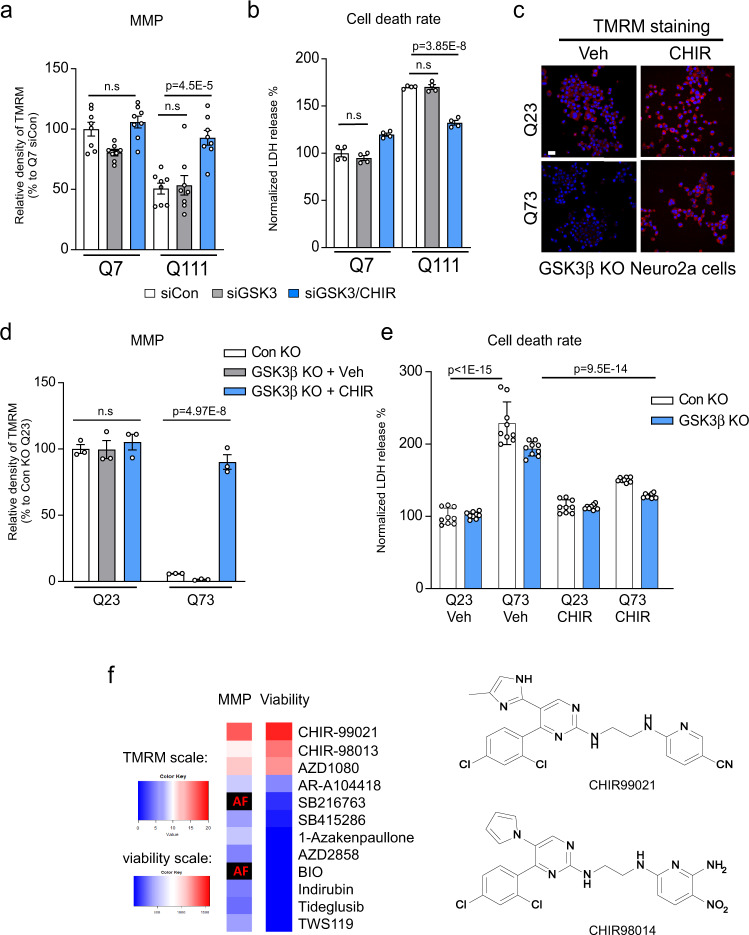
Fig. 3. The protective effects of CHIR99021 in HD is independent of GSK3.
HdhQ7 and HdhQ111 cells were transfected with small interfering RNA (siRNA) control (siCon) or GSK3 (siGSK3) for 3 days, followed by CHIR99021 (3 µM) treatment for 48 h. a Mitochondrial membrane potential (MMP) was examined by TMRM staining; quantification of TMRM density is shown (n = 8). b Cell death was measured by lactate dehydrogenase (LDH) release after 16 h serum starvation (n = 4). Neuro2a cells were transfected with vectors expressing control guide RNA (gRNA) or GSK3β gRNA and Cas9. After confirming GSK3 knockout (Supplementary Fig. 3c), cells were transfected with Myc-tagged Q23-Htt (Q23) or Q73-Htt (Q73) constructs for 12 h, followed by a 2-day incubation with CHIR99021 (3 μM) or vehicle (Veh). c Representative TMRM images of the indicated groups. Scale bar = 30 μm. d Quantification of TMRM fluorescence density is shown (n = 3). e Cell death in the indicated groups was measured by LDH release (n = 9). f Heat maps representing the effects of 12 GSK3 inhibitors on MMP (left) and cell viability following serum withdrawal (right). All molecules were assessed at 8 doses ranging from 0.078 to 10 μM. MMP data are presented as the area under the dose–response curve of TMRM signal increase relative to DMSO-treated cells. Viability data are presented as the integral of the increase in non-apoptotic cells across all doses. AF: compound autofluorescence prevents an accurate assessment. TMRM scale: 0–20, viability scale: 0–1500. The CHIR99021 structure and its chemical analog, CHIR98014, are shown on the right. All values are reported as mean ± SEM and compared using one-way ANOVA with Tukey’s post hoc test in a, b, two-way ANOVA with Šídák’s post hoc test in d, and two-way ANOVA with Dunnett’s post hoc test in e. Data are representative of at least three independent experiments. Exact p values are shown in the figures.

