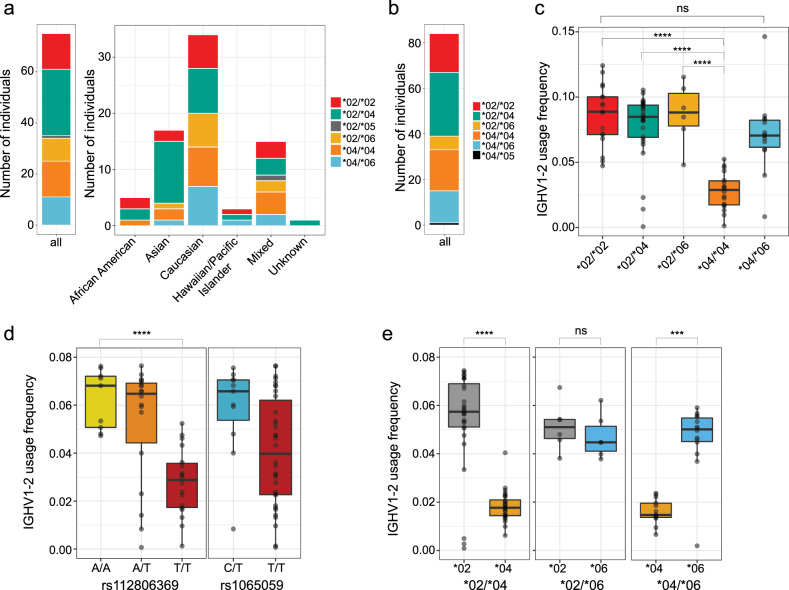
Fig. 5. Population-level IGHV1-2 genotype frequencies and allele-specific effects on naive antibody repertoire usage.
a Number of individuals of each inferred IGHV1-2 genotype in the collective cohort (left) and within each population subgroup (right), based on allele inferences made using RNA-seq data (n = 75 donors). b Number of individuals of each IGHV1-2 genotype based on inferences made from IgM/IgD expressed antibody RepSeq data (n = 84 donors). c IGHV1-2 gene usage within the IgM/IgD repertoire partitioned by IGHV1-2 genotype (n = 83 donors). d IGHV1-2 gene usage in the IgM/IgD repertoire partitioned by genotypes at SNPs rs112806369 and rs1065059 (n = 83 donors). e IGHV1-2 allele-specific usage within the IgM/IgD repertoire in IGHV1-2 heterozygotes (*02/*04, n = 28 donors; *02/*06, n = 6; *04/*06, n = 14). All boxplots are plotted as follows: center line, median; box limits, upper and lower quartiles; whiskers, 1.5× interquartile range; points outside the whiskers, outliers. One-way ANOVA: ***P < 0.0001; ****P < 0.00001; ns not significant.

