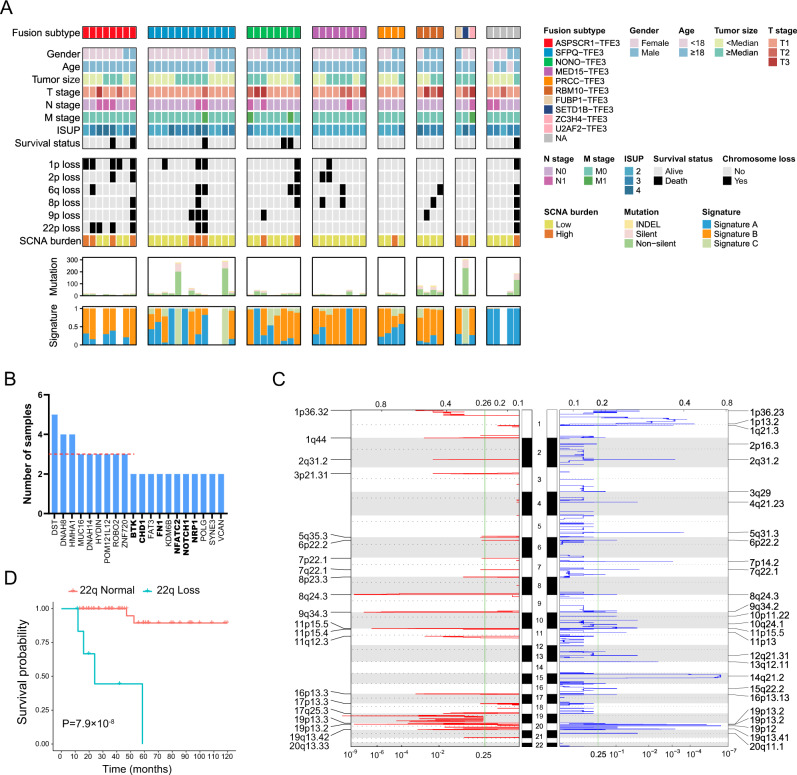
Fig. 3. The mutational landscape of TFE3-tRCC.
A Clinical features and molecular data for 53 tumors (rows) are displayed as heatmaps. Each column represents an individual tumor. Patients were separated into eight groups: those with ASPSCR1-TFE3 (n = 8), with SFPQ-TFE3 (n = 13), with NONO-TFE3 (n = 8), with MED15-TFE3 (n = 8), with PRCC-TFE3 (n = 4), with RBM10-TFE3 fusions (n = 4), with rare TFE3-associated gene fusions (n = 3, including FUBP1-TFE3, SETD1B-TFE3, and ZC3H4-TFE3) and unknow partners (n = 5). The top panel shows fusion partners. The middle panel shows clinical features, including gender, age, tumor size, TNM stage, ISUP, survival status, SCNA, and SCNA burden. Each subsequent panel displays a specific molecular profile: number of mutations and the fraction of each COSMIC signature in the genome. B Frequently mutated genes in the TFE3-tRCC cohort. The red dashed line denotes three mutated patients. Tumor suppresser genes are labeled with bold font. C Focal amplification and deletion determined from GISTIC 2.0 analysis. The green line indicates the cut-off for significance (q = 0.25). P values significantly peaks were identified at FDR q value <0.25. The top and bottom numerical values refer to G-scores and q values, respectively. D Kaplan–Meier curves show the OS between the patients with 22p loss and 22p normal. P value was determined by two-sided log-rank test. TFE3-tRCC TFE3-translocation renal cell carcinoma, ISUP International Society of Urological Pathology, SCNA somatic copy number alteration, OS overall survival.

