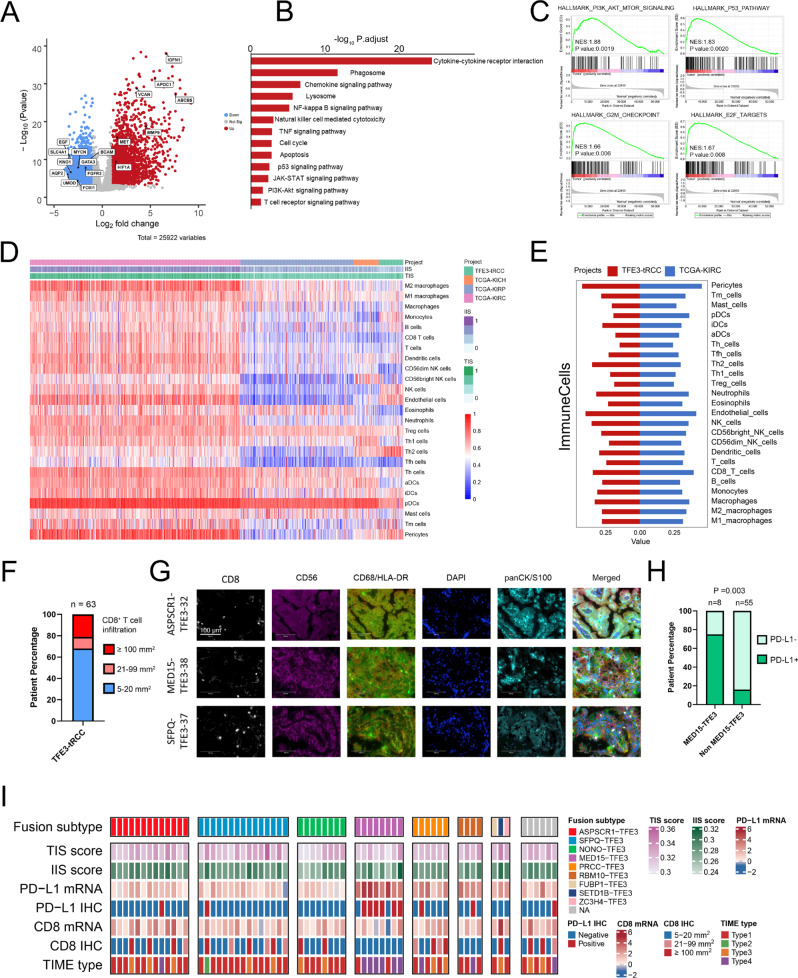
Fig. 4. Transcriptional features and immunogenic phenotype in TFE3-tRCC.
A A volcano plot representing differentially expressed genes between the tumors and paired adjacent normal tissues. Significantly upregulated genes are colored in red, whereas significantly downregulated genes are colored in blue. The q values (-log10 p) were calculated using paired two-sided moderated Student’s t test. B Kyoto Encyclopedia of Genes and Genomes enrichment analysis of differentially expressed genes. Enrichment q values (-log10 p) are calculated by hypergeometric test. C GSEA enrichment scores of PI3K-AKT-mTOR, P53, G2M Checkpoint, and E2F targets pathways in TFE3-tRCC versus normal tissues. D Unsupervised clustering of samples from the TCGA RCC and our TFE3-tRCC cohorts (n = 63) using ssGSEA scores from 25 immune cell types, IIS and TIS. KICH (n = 65), KIRC (n = 539), KIRP (n = 289). E Comparing the expression of 25 immune cell types, IIS and TIS between TCGA-KIRC (n = 539) and our TFE3-tRCC cohorts (n = 63). (F) Bar chart depicts the prevalence of CD8 expression by immunohistochemistry. G Representative immunofluorescence demonstrating the presence of overall CD8 + T-cell, tumor-associated macrophage (CD68 and HLA-DR), and NK cell (CD56) infiltration in three selected samples (TFE3-32, TFE3-38, and TFE3-37) in our cohort. Ten random high-power fields of tumor parenchyma were checked for CD8, CD68, HLA-DR, and CD56 positive expression. Magnification × 400. Scale bar = 100 μm. H Bar chart depicts the prevalence of PD-L1 expression by immunohistochemistry. P-values were determined by Pearson’s chi-square test. I) Heatmap shows the immune features among TFE3-tRCCs (n = 63). Each column represents an individual tumor. Patients were separated into eight groups: those with ASPSCR1-TFE3 (n = 13), with SFPQ-TFE3 (n = 15), with NONO-TFE3 (n = 8), with MED15-TFE3 (n = 8), with PRCC-TFE3 (n = 6), with RBM10-TFE3 fusions (n = 4), with rare TFE3-associated gene fusions (n = 3, including FUBP1-TFE3, SETD1B-TFE3, and ZC3H4-TFE3), and unknow partners (n = 6). The top panel shows fusion partners and isoforms. The bottom panel shows immune features, including TIS, IIS, PD-L, CD8, and TIME type. TFE3-tRCC TFE3-translocation renal cell carcinoma, TCGA The Cancer Genome Atlas. KICH chromophobe renal cell carcinoma, KIRC renal clear cell carcinoma, KIRP renal papillary cell carcinoma, IIS immune infiltration score, TIS T-cell infiltration score, IHC immunohistochemistry, TIME tumor immune microenvironment.

