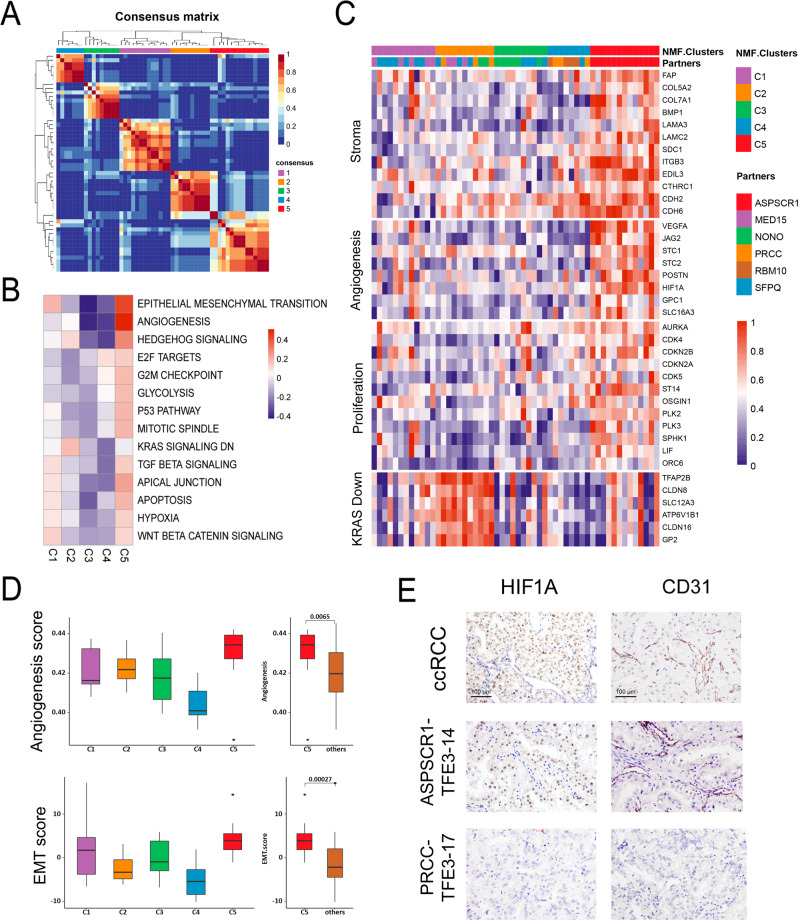
Fig. 5. Transcriptional stratification identifies TFE3-tRCC tumor subsets with distinct biologic features.
A Consensus matrix depicting clusters (k = 5) identified by NMF clustering of tumors with definite fusion partners (n = 54). B Heatmap representing MSigDb hallmark gene set QuSAGE enrichment scores for each NMF tumor cluster compared with all other tumors. White cells represent non-significant enrichment after FDR correction. C Heatmap of genes comprised in transcriptional signatures. Samples are grouped by NMF cluster. D Comparative angiogenesis score (top) and EMT score (bottom) in samples between the different NMF tumor clusters (C1–C5). C1, n = 12; C2, n = 11; C3, n = 10; C4, n = 8; C5, n = 13; others = C1 + C2 + C3 + C4, n = 41. Box plots show median levels (middle line), 25th and 75th percentile (box), 1.5 times the interquartile range (whiskers) as well as outliers (single points). P values were determined by the two-sides Mann–Whitney U test. E Representative IHC demonstrating HIF1A and CD31 expression in two selected samples (TFE3-14 and TFE3-17) in our cohort and one positive control (ccRCC with VHL mutant). Five random high-power fields were checked for HIFA and CD31 positive expression. Magnification × 200. Scale bar = 100 μm. TFE3-tRCC TFE3-translocation renal cell carcinoma, NMF non-negative matrix factorization, EMT epithelial-mesenchymal transition, IHC immunohistochemistry.

