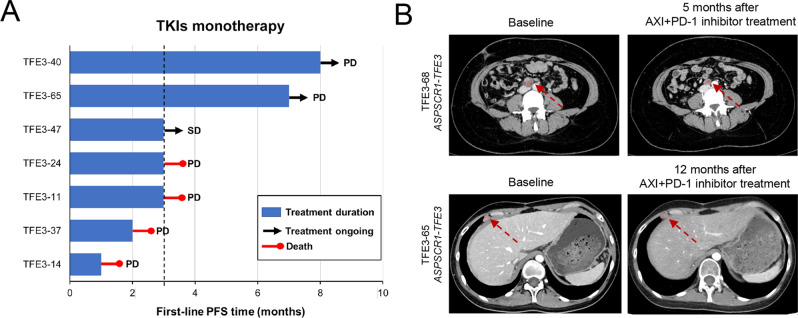
Fig. 6. Responses to systemic treatment and potential therapeutic targets for patients with TFE3-tRCC.
A Swimmer plot depicts the PFS of individual patients receiving first-line TKIs treatments. Vertical line indicates PFS at 3 months. B Baseline imaging in two patients (TFE3-68 and TFE3-65) before initiation of systematic treatment and after they received the combination of pembrolizumab plus axitinib treatment. TFE3-tRCC TFE3-translocation renal cell carcinoma, TKIs tyrosine kinase inhibitor, PFS progression-free survival. Arrow indicates tumor lesion.

