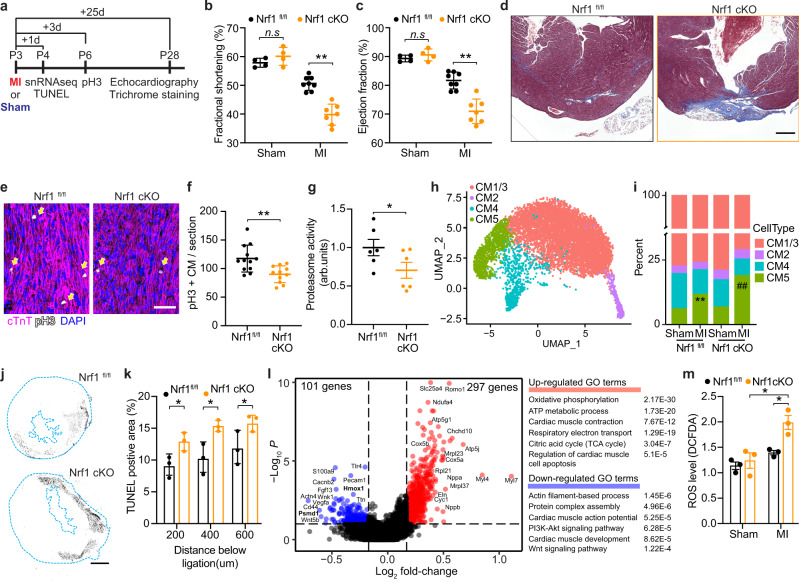
Fig. 2. Nrf1 deletion impairs neonatal heart regeneration.
a Illustration showing timeline of MI and Sham surgeries performed at P3 and subsequent days of sample collection. b, c Fractional shortening (b) and ejection fraction (c) of Nrf1fl/fl and Nrf1 cKO mouse hearts at 25 days after MI or Sham surgery; n = 4 animals for Sham groups and n = 7–8 animals for MI groups; **p = 0.0022 (b), **p = 0.0009 (c) by Student’s t-test two-tailed. d Masson’s trichrome staining showing fibrotic scarring in Nrf1fl/fl and Nrf1 cKO mouse hearts at 25-day after MI; similar results were observed in six animals; Scale bar, 200 μm. e Immunohistochemistry showing pH3+ cardiomyocytes (cTnT+), marked by arrows, in heart sections collected from Nrf1 cKO and Nrf1fl/fl mice 3-day post-MI; Scale bar, 50 μm. f Quantification of pH3+ cardiomyocytes (cTnT+) in heart sections from (e); n = 12 animals for WT and n = 11 animals for Nrf1 cKO, **p = 0.0034 by Student’s t-test two-tailed. g Chymotrypsin-like activity of the proteasome in hearts from Nrf1 cKO and Nrf1fl/fl mice at P4. arb. units, arbitrary units; n = 6 animals for each group; *p = 0.0373 by Student’s t-test one-tailed. h UMAP visualization of cardiomyocyte clusters colored by identity. CM1 and CM3 were merged as a single cluster due to their transcriptome similarity. i Fraction of cardiomyocyte populations in Nrf1fl/fl and Nrf1 cKO hearts in MI or Sham conditions; n = 4–6 animals for each group examined over 1 independent experiment; **p = 4.49E−16 compared to WT-Sham, ##p = 5.05E−31 compared to KO-Sham; Chi-squared test. j Representative images showing TUNEL staining on heart sections from Nrf1 cKO and Nrf1fl/fl mice at 1-day post-MI; Scale bar, 500 μm. k Quantification of TUNEL positive area in heart sections collected at 200, 400, and 600 μm below the ligation from Nrf1 cKO and Nrf1fl/fl mice at 1-day post-MI; n = 3 animals for each group; *p = 0.039 (200 μm); p = 0.025 (400 μm), p = 0.047 (600 μm), Student’s t-test two-tailed. l Volcano plot showing fold-change and p-value of genes up-regulated (red) and down-regulated (blue) in CM4 cells of Nrf1 KO hearts compared to CM4 cells in control hearts at 1-day post-MI; p-adjust < 0.1 and fold-change > 1.5 were used for cutoffs; p-adjust values are calculated by Wilcoxon rank-sum test two-tailed. Top enriched GO terms are shown (right). m Quantification of ROS levels in Nrf1 cKO and Nrf1fl/fl mice at 3-day post-MI or Sham; n = 3 animals for each group. WT-MI vs Nrf1 cKO-MI, *p = 0.015; Nrf1 cKO-Sham vs. Nrf1 cKO-MI, *p = 0.022, by Student’s t-test two-tailed. b, c, f, g, k, m results are shown as mean ± s.e.m.; n.s. not significant.

