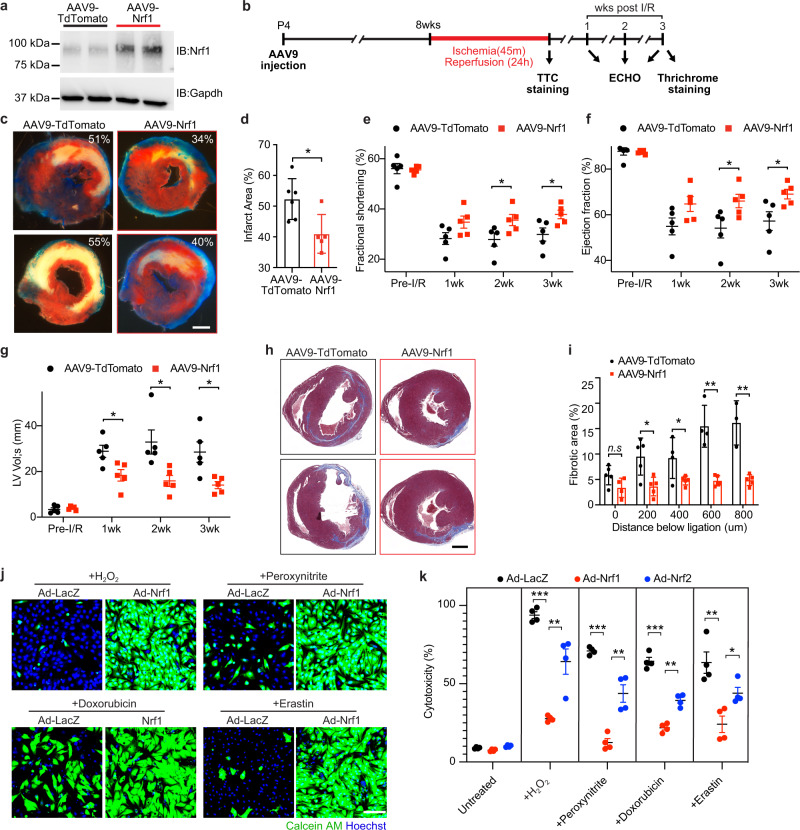
Fig. 3. Nrf1 overexpression protects cardiomyocytes against I/R and cardiotoxin injury.
a Western blot analysis showing Nrf1 expression in hearts from mice at 4-week after AAV9-TdTomato and AAV9-Nrf1 injection at P4; experiments were repeated independently twice with similar results. b Illustration of a timeline showing the experimental design for AAV9 injection and time points of sample collections. c TTC staining showing infarct size on transverse heart sections collected at the end of reperfusion; Scale bar, 500 μm. d Quantification of infarct area in sections from (c); AAV9-TdTomato, n = 6; AAV9-Nrf1, n = 5; *p = 0.0183, by Student’s t-test two-tailed. e–g Fractional shortening (e), ejection fraction (f), and systolic volume (g) of left ventricles from AAV9-TdTomato and AAV9-Nrf1 hearts at baseline (before I/R), and 1–3 weeks (wk) after I/R; n = 5 animals for each group. e 2wk, *p = 0.0388; 3wk, *p = 0.034. f 2wk, *p = 0.0422; 3wk, *p = 0.0336. g 1wk, *p = 0.0207, 2wk, *p = 0.0188; 3wk, *p = 0.0155. h Masson’s trichrome staining showing fibrotic scarring on transverse sections of hearts collected at 600 μm below the ligation suture; Scale bar, 500 μm. i Quantification of fibrotic regions of heart sections collected at multiple planes below the ligation suture from AAV-TdTomato and AAV-Nrf1 mice; AAV9-TdTomato, n = 5; AAV9-Nrf1, n = 4; 200 μm, *p = 0.012, 400 μm, *p = 0.0455, 600 μm, *p = 0.0007, 800 μm, *p = 0.0012. j Viable NRVMs with adenoviral (Ad) overexpression of LacZ or Nrf1 following H2O2, peroxynitrite, doxorubicin, and erastin treatments, indicated by Calcein AM (green); Scale bar, 100 μm. k Cell death measured by lactate dehydrogenase (LDH) release in NRVMs-overexpressing LacZ, Nrf1, or Nrf2 following toxin treatments; n = 4 biologically independent experiments for each group. H2O2, ***p < 0.000001, **p = 0.0043. Peroxynitrite, ***p < 0.000001, **p = 0.0022. Doxorubicin, ***p = 0.000006, **p = 0.0003. Erastin, **p = 0.0039, *p = 0.0215. d–g, i, k Results are shown as mean ± s.e.m.; Student’s t-test two-tailed; n.s. not significant.

