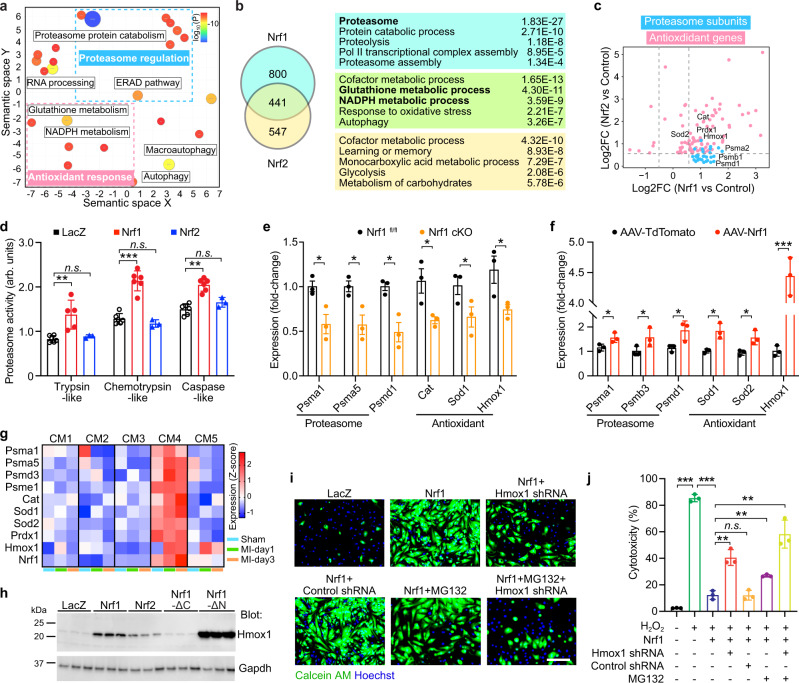
Fig. 4. Nrf1 confers protection by regulating the proteasome and antioxidant response.
a Gene ontology analysis of genes upregulated in Nrf1 samples compared to LacZ control samples. Upregulated genes are displayed in semantic space as clusters; the color and proportional size of circles indicate log10 (P value). P values were obtained using Metascape (see the “Methods” section). b Left: Venn diagram showing a number of genes upregulated by Nrf1, Nrf2, or both; Right: top enriched GO terms for each gene group. c Log2 fold-change (FC) of selected proteasome subunit genes (blue) and antioxidant genes (pink) in NRVMs overexpressing Nrf1 (x-axis) or Nrf2 (y-axis). d Proteasomal activity in arbitrary units (arb. units) of NRVMs overexpressing LacZ, Nrf1 or Nrf2; n = 6 biologically independent experiments for groups LacZ and Nrf1; n = 3 biologically independent experiments for group Nrf2; Trypsin-like, **p = 0.0030; Chemotrypsin-like, ***p = 0.000009; Caspase-like, **p = 0.000031. e qPCR measurement of proteasome subunit genes and antioxidant genes in Nrf1 cKO and control hearts at P14; n = 3 for each group. Psma1, *p = 0.0266; Psma5, *p = 0.0261; Psmd1, *p = 0.0120; Cat, *p = 0.0364; Sod1,*p = 0.0462, Hmox1, *p = 0.0510. f qPCR measurement of proteasome subunit genes and antioxidant genes in AAV-Nrf1 and AAV-TdTomato hearts from 2-month-old mice; n = 3 for each group. Psma1, *p = 0.0459; Psmb3, *p = 0.0426; Psmd1, *p = 0.0507; Sod1, *p = 0.0128; Sod2, *p = 0.0268, Hmox1, ***p = 0.0001. g Expression of proteasome subunit genes and antioxidant genes in CM1–CM5 cells from our previous snRNA-seq data (GSE130699). Expression levels in z-scores from 1-day post-Sham (Sham), 1-day post-MI (MI-day1), and 3-day post-MI (MI-day3) samples were plotted. h Western blot showing Hmox1 expression in NRVMs overexpressing LacZ, Nrf1, Nrf2, Nrf1-ΔN, or Nrf1-ΔC. i, j Viable cells (i, green) and percent of cell death (j) in NRVMs overexpressing Nrf1 plus Hmox1 shRNA, or MG132 treatment, or both, following H2O2 treatment; n = 3 biologically independent experiments. ***p < 0.0001, **p = 0.002 (column 3 vs. 4 and column 3 vs. 7), **p = 0.0018 (column 3 vs. 6). Scale bar, 100 μm; d, e, f, j results are shown as mean ± s.e.m.; Student’s t-test two-tailed; n.s. not significant.

