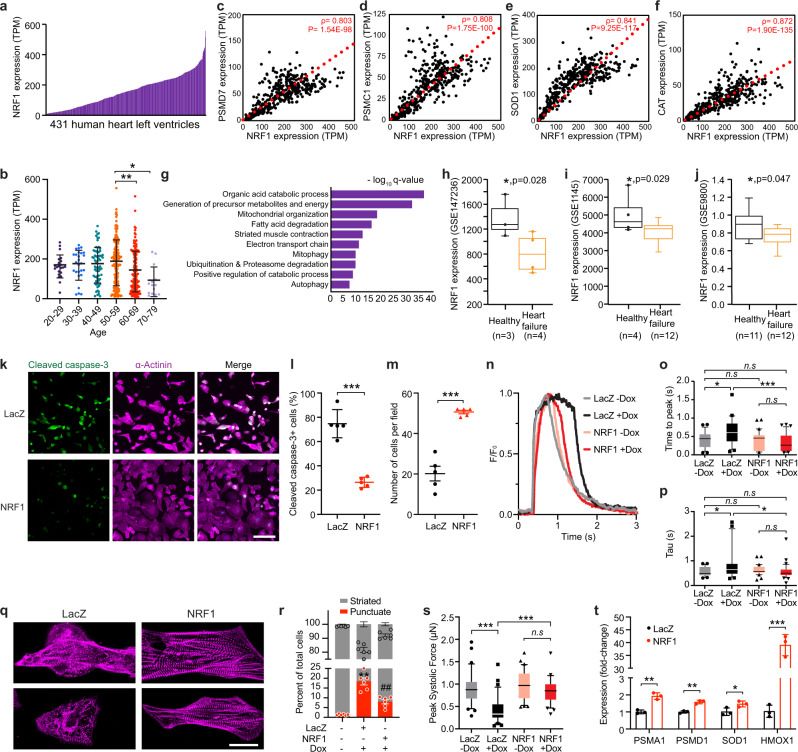
Fig. 5. NRF1 is an essential stress regulator in human iPSC-derived cardiomyocytes.
a Expression (TPM, transcript per million reads) of NRF1 in 431 human heart left ventricle samples from the GTEx database. Samples were collected from 293 males and 138 females. b Expression of NRF1 grouped by age. Age 20–29, n = 22; Age 30–39, n = 26; Age 40–49, n = 66; Age 50–59, n = 154; Age 60–69, n = 149; Age 70–79, n = 14; *p = 0.0106, **p = 0.0027, one-way ANOVA test. c–f Expression correlation plots showing that PSMD7 (c), PSMC1 (d), SOD1 (e), and CAT (f) are highly co-expressed with NRF1 in the 431 human heart left ventricle samples from the GTEx database. Spearman’s correlation coefficient (ρ) and p-values are depicted; one-tailed t-test. g Top enriched GO terms for the 1167 NRF1 co-expressed genes. h–j NRF1 expression is significantly reduced in heart ventricular tissue from patients with heart failure compared to healthy hearts. Box-and-whisker plots are provided in which the central line denotes the median value, the edges of the boxes represent the upper and lower quartiles, and whiskers indicate the minimum and maximum values; *p < 0.05 with exact p-value depicted. h RNAseq data from GSE147236; n = 4 for heart failure, n = 3 for healthy control; two-tailed Wald test. i Affymetrix microarray data from GSE1145; n = 12 for heart failure, n = 4 for healthy control; Wilcoxon rank sum test two-tailed. j Agilent microarray data from GSE9800; n = 12 for heart failure, n = 11 for healthy control; Wilcoxon rank-sum test two-tailed. k Immunostaining of cleaved caspase-3 and α-actinin in hPSC-CMs overexpressing NRF1 or LacZ after Dox treatment. Scale bar, 100 μm. l, m Quantification of the percentage of cleaved caspase-3+ cardiomyocytes (l) and total cell number (m) in hPSC-CMs overexpressing NRF1 or LacZ after Dox treatment. ***p < 0.0001, Student’s t-test two-tailed. n Calcium transient in hPSC-CMs overexpressing NRF1 or LacZ with and without Dox treatment; n = 29–33 cells from two independent experiments were measured for each group. o, p Quantification of time-to-peak (o) and average decay time (Tau) (p) of calcium transient in hPSC-CMs overexpressing NRF1 or LacZ with and without Dox treatment; n = 29–33 cells from two independent experiments were measured for each group. o *p = 0.0163, ***p = 0.0004; p LacZ (−Dox) vs. LacZ (+Dox), *p = 0.0479; LacZ (+Dox) vs. Nrf1 (+Dox), *p = 0.0416; one-way ANOVA. q Immunostaining with α-actinin antibody showing sarcomere disarray in LacZ control cells and preserved sarcomere organization in NRF1-expressing cells after Dox treatment. Scale bar, 20 μm; r Quantification of the percentage of sarcomere disarray in hPSC-CMs overexpressing NRF1 or lacZ treated with Dox; n = 481 cells from six independent experiments were measured for the ‘−Dox’ group; n = 83 cells from six independent experiments were measured for the ‘LacZ + Dox’ group; n = 233 cells from six independent experiments were measured for the ‘NRF1 + Dox’ group. **p < 0.0001 compared to untreated ‘−Dox’ sample; ##p = 0.001 compared to ‘LacZ + Dox’ sample; Student’s t-test two-tailed. s Peak systolic force of single hPSC-CMs overexpressing NRF1 or LacZ with (+Dox) and without (−Dox) Dox treatment; n = 34 for LacZ (−Dox), n = 32 for LacZ (+Dox), n = 36 for NRF1 (−Dox), and n = 35 for NRF1 (+Dox) from two independent experiments; ***p < 0.0001, one-way ANOVA. t qPCR measurement of proteasome subunit genes, PSMA1 and PSMD1, and antioxidant genes, SOD1 and HMOX1, in hPSC-CMs overexpressing NRF1 or LacZ; n = 3 for each group; PSMA1, **p = 0.0019; PSMD1, **p = 0.0013; SOD1, *p = 0.0486; HMOX1, ***p < 0.0001; Student’s t-test two-tailed. b, l, t results are shown as mean ± s.d.; m, r results are shown as mean ± s.e.m.; o, p, s Box-and-whisker plots are provided in which the central line denotes the median value, the edges of the boxes represent the upper and lower quartiles, and whiskers indicate the 10–90 percentile values with points below or above the whiskers shown as individual dots. n.s. not significant.

