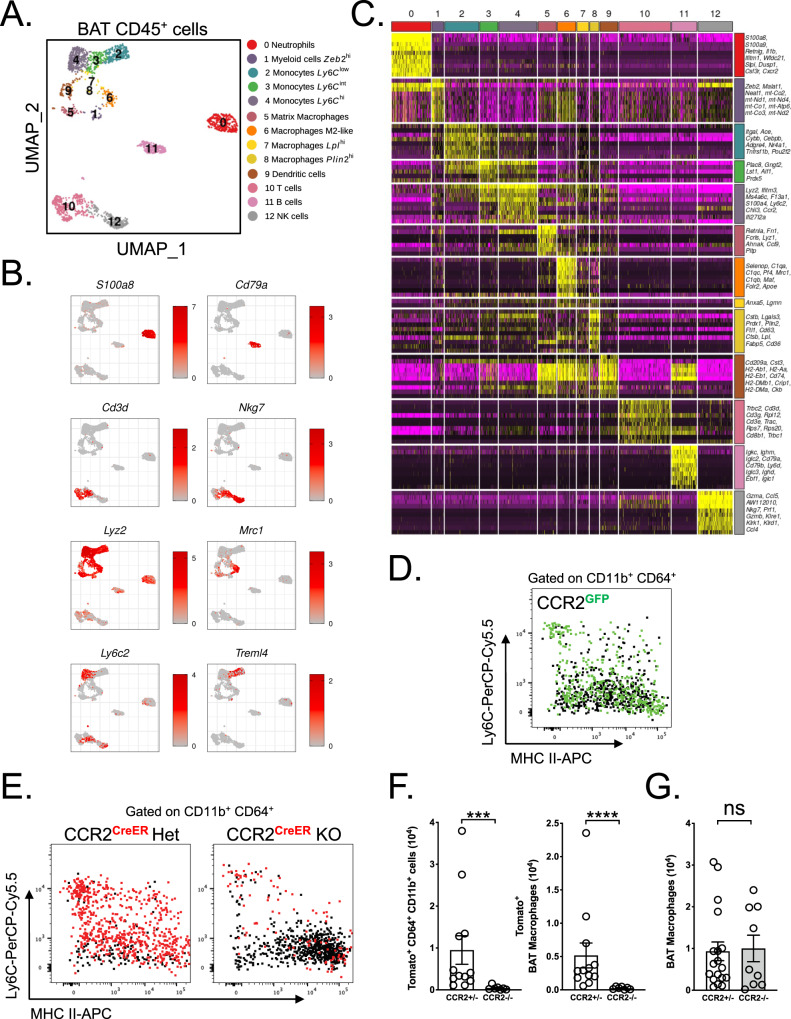
Fig. 1. Monocytes contribute to BAT macrophage pool at a steady state.
A Single-cell RNA-Seq analysis of BAT CD45+ cells from 7−8-week-old male mice. B UMAP representations of genes used to identify cell types among BAT CD45+ cells. C Heatmap showing normalized expression levels of marker genes helping to identify cell types present in the data. D Flow cytometry plot showing CCR2GFP expression among BAT Ly6C+/– MHCII+/– cells (gated on CD45+ CD11b+ CD64+ cells). E Flow cytometry plot showing TdTomato expression among BAT Ly6C+/– MHCII+/– cells (gated on CD45+ CD11b+ CD64+ cells) from CCR2creERT2/+ and CCR2creERT2/GFP mice 48 h after tamoxifen gavage. F Quantification of TdTomato+ cells among CD45+ CD64+ CD11b+ cells (p = 0.0002) and macrophages (CD45+ CD64+ CD11b+ Ly6C–) (p < 0.0001) in the BAT of CCR2creERT2/+ (CCR2+/–, n = 12) and CCR2creERT2/GFP (CCR2–/–, n = 7) mice 48 h after tamoxifen gavage. G Quantification of macrophages in the BAT of CCR2+/– (n = 18) and CCR2–/– (n = 9) mice, p = 0.8997. Panels D, E, F, and G represent pooled data from two independent experiments. All data are represented in means ± SEM. Two-tailed Mann−Whitney tests were used to determine statistical significance. ns p > 0.05; *p < 0.05; **p < 0.01. Source data are provided as a Source Data file.

