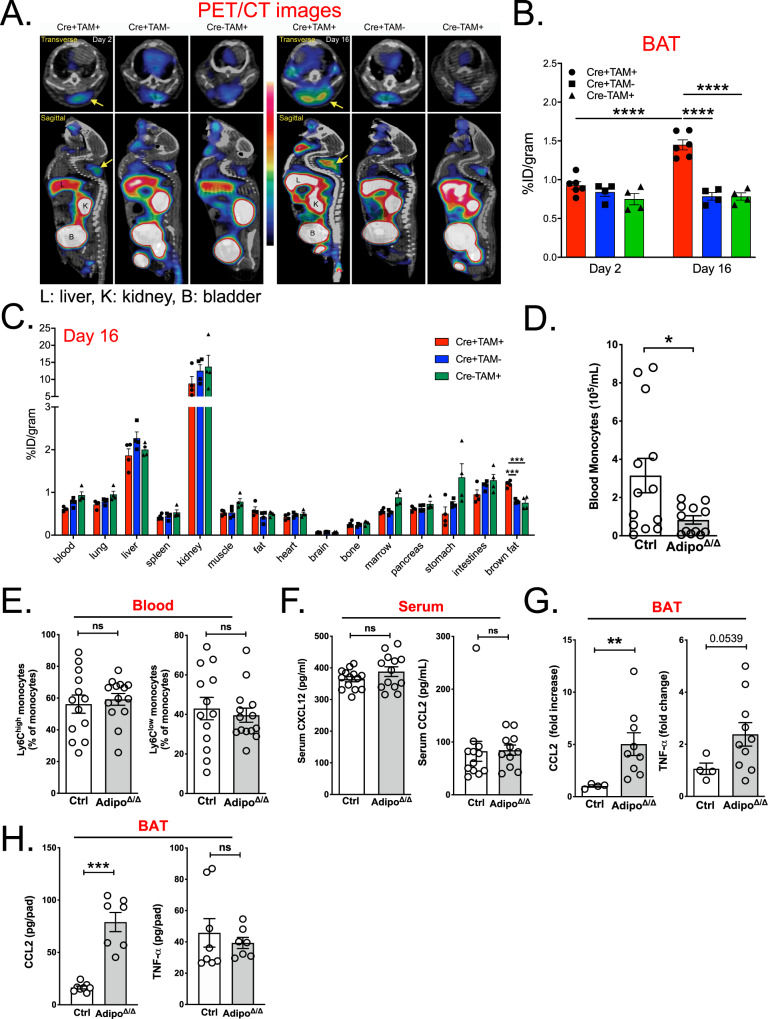
Fig. 3. Adipocyte ATGL deletion induces a specific recruitment of blood monocytes to the BAT.
A64Cu-DOTA-ECL1i PET/CT images analyzing tracer uptake in control and Adipo∆/∆ mice 2 days (left panel) and 16 days (right panel) post-tamoxifen administration (n = 4−6/group). L: liver; B: bladder; K: kidney. B Quantification of tracer uptake in the BAT of Cre− tamoxifen-treated (Cre− Tam+, n = 4) and Cre+ vehicle-treated (Cre+ Tam−, n = 4) controls and Adipo∆/∆ animals (Cre+ Tam+, n = 6) 2- and 16-days post-tamoxifen administration. p < 0.0001 for each comparison. C Biodistribution of 64Cu-DOTA-ECL1i in Cre− Tam+ and Cre+ Tam-controls and Adipo∆/∆ animals 16 days post-tamoxifen administration (n = 4/group). p < 0,001 for each comparison in BAT. D Quantification of blood monocyte counts in control (n = 13) and Adipo∆/∆ (n = 12) mice using flow cytometry. p = 0.0384. E Proportions of Ly6Chigh and Ly6Clow monocytes among total blood monocytes in control (n = 13) and Adipo∆/∆ (n = 14) mice using flow cytometry. p = 0.6940 (left) and p = 0.6160 (right). F Analysis of serum CCL2 and CXCL12 in control (n = 14) and Adipo∆/∆ (n = 13) mice by ELISA. p = 0.2388 (left) and p = 0.3793 (right). G Analysis of BAT CCL2 and TNFα expression in control (n = 4) and Adipo∆/∆ (n = 9 and 10 respectively) mice by qPCR. p = 0.0028 (left) and p = 0.0539 (right). H Quantification of CCL2 and TNFa protein levels in BAT homogenates from control (n = 8) and Adipo∆/∆ (n = 7) mice by ELISA. p = 0.0003 (left) and p = 0.6126 (right). Panels D, E represent pooled data from four independent experiments. Panels F, G represent pooled data from two independent experiments. Panel H represents data from one experiment. All data are represented in means ± SEM. Ordinary one-way ANOVA with Bonferroni post-test were used to determine statistical significance in panels B, C. Two-tailed Mann−Whitney tests were used to determine statistical significance in panels D−H. ns p > 0.05; *p < 0.05; **p < 0.01; ***p < 0.001; ****p < 0.0001. Source data are provided as a Source Data file.

