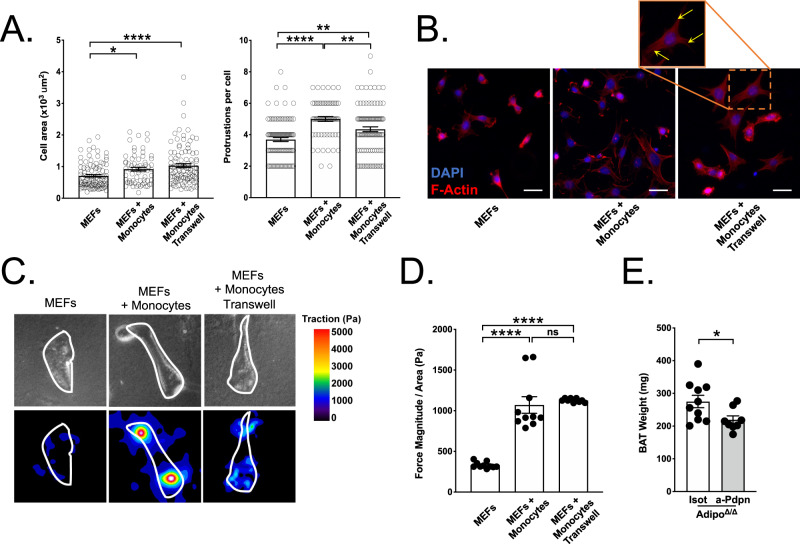
Fig. 5. Monocyte interaction with fibroblasts through the Podoplanin axis is required for BAT expansion.
A Quantification of MEF morphological features after a 18 h co-culture experiment with monocytes placed in the same well or in a transwell insert with 0.4 μm pores. Each dot represents a cell. n = 101 (MEFs), 64 (MEFs + Monocytes) and 103 (MEFs + Monocytes Transwell) cells representative of three independent experiments. *: p = 0.0257, ****: p = <0.0001 (left). **: p < 0.01, ****: p < 0.0001(right). B Representative images of MEF morphology after a 18 h co-culture experiment with monocytes placed in the same well or in a transwell insert with 0.4 μm pores. F-actin was revealed using phalloidin staining. Yellow arrows indicate protrusions. Scale bar = 20 μm. Representative heat map (C) and quantification (D) showing contractile forces generate by MEFs plated on 8 kPa hydrogel after a 18 h co-culture experiment with monocytes placed in the same well or in a transwell insert with 0.4 μm pores. Mean of n = 10 wells per condition. ****: p < 0.0001. E Brown adipose tissue weight in anti-Podoplanin (n = 8) or isotype control-treated (n = 10) Adipo∆/∆ mice. p = 0.0363. Panels A, B are representative of three independent experiments. Panel D is representative of two independent experiments. Panel E represents pooled data from two independent experiments. All data are represented in means ± SEM. Ordinary one-way ANOVA with Bonferroni post-test were used to determine statistical significance in panels (A, D). A two-tailed Mann−Whitney test was used to determine statistical significance in panel (E). ns p > 0.05; *p < 0.05; **p < 0.01; ***p < 0.001. Source data are provided as a Source Data file.

