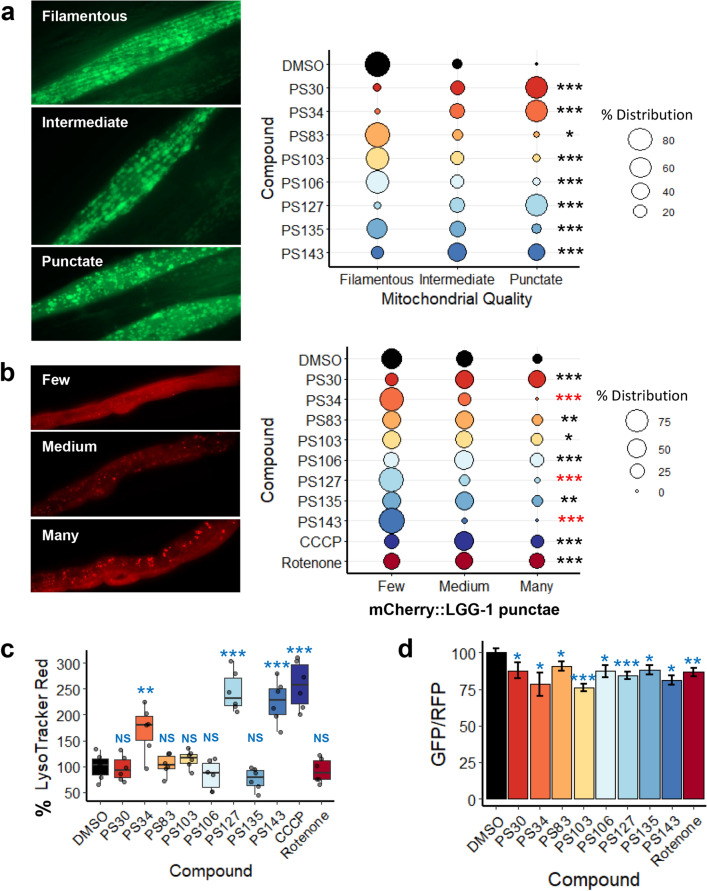
Figure 2.
PS compounds induced mitochondrial fragmentation and mitophagy. (a, b) Fluorescent images and quantification of fluorescence of C. elegans carrying (a) Pmyo-3::GFPmt or (b) mCherry::LGG-1/LC3 upon 15 h of treatment with PS compounds. (c) Quantification of LysoTracker Red fluorescence upon 15 h of treatment with DMSO, PS compounds, CCCP, or rotenone. (d) GFP/RFP ratio of Rosellamt upon 15–34 h of treatment with PS compounds. For (a, b), percent distribution for each category was calculated and plotted, Chi-square statistic tests were performed, and representative images are shown. Three biological replicates with ~ 30 worms/replicate were analyzed. For (c), at least four biological replicates with ~ 400 worms/replicate were analyzed. For (d), at least three biological replicates with ~ 20 worms/replicate were analyzed. Representative images for (d) were shown in Fig. S2. For (c, d), p-values were determined from one-way ANOVA, followed by Dunnett’s test. All fold changes were normalized to DMSO control (at 100%), thus increased fluorescence (as compared to DMSO) will cause quantification values to be over 100%. NS not significant, *p < 0.05, **p < 0.01, ***p < 0.001. In (b), black star indicates significance of increase while red indicates significance of decrease of mCherry::LGG-1 punctae formation.

