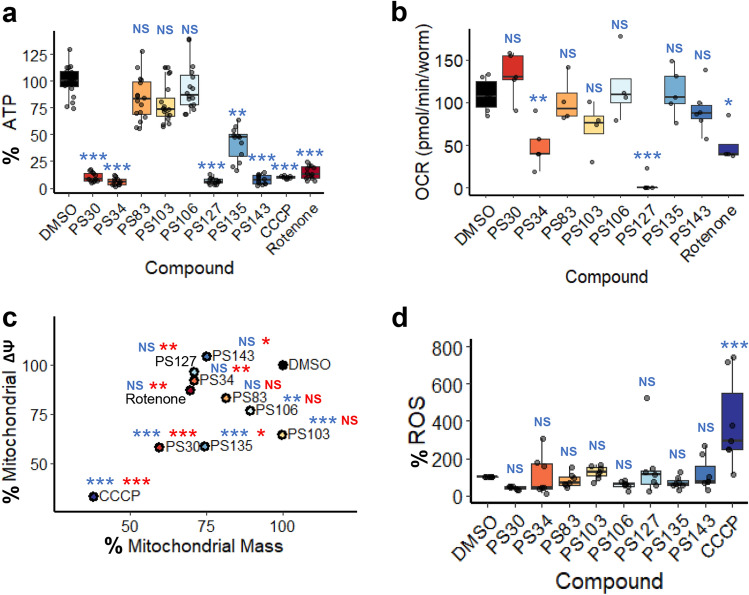
Figure 3.
PS compounds differently affected multiple mitochondrial parameters. (a) Quantification of luminescence (normalized to GFP) of C. elegans carrying Psur-5::luciferase::GFP upon 19 h of treatment with DMSO, PS compounds, CCCP, or rotenone. (b) Oxygen consumption rate (pmol/min/worm) measurement of wild-type worms upon 8 h of treatment with PS compounds or rotenone. (c) Point plot of MitoTracker Green (mitochondrial mass, x-axis) and MitoTracker Red (mitochondrial membrane potential, y-axis) fluorescence of wild-type worms upon 15 h of treatment with PS compounds or CCCP. (d) Quantification of DHE fluorescence upon 15 h of treatment with PS compounds or CCCP. At least three biological replicates with (a, c, d) ~ 400 worms/replicate or (b) 6000 worms/replicate were analyzed. p-values were determined from one-way ANOVA, followed by Dunnett’s test. For (a, c, d), fold-changes were normalized to DMSO control (at 100%). NS not significant, *p < 0.05, **p < 0.01, ***p < 0.001. In (c), blue color indicates significance of change in mitochondrial membrane potential; red indicates significance of change in mitochondrial mass.

