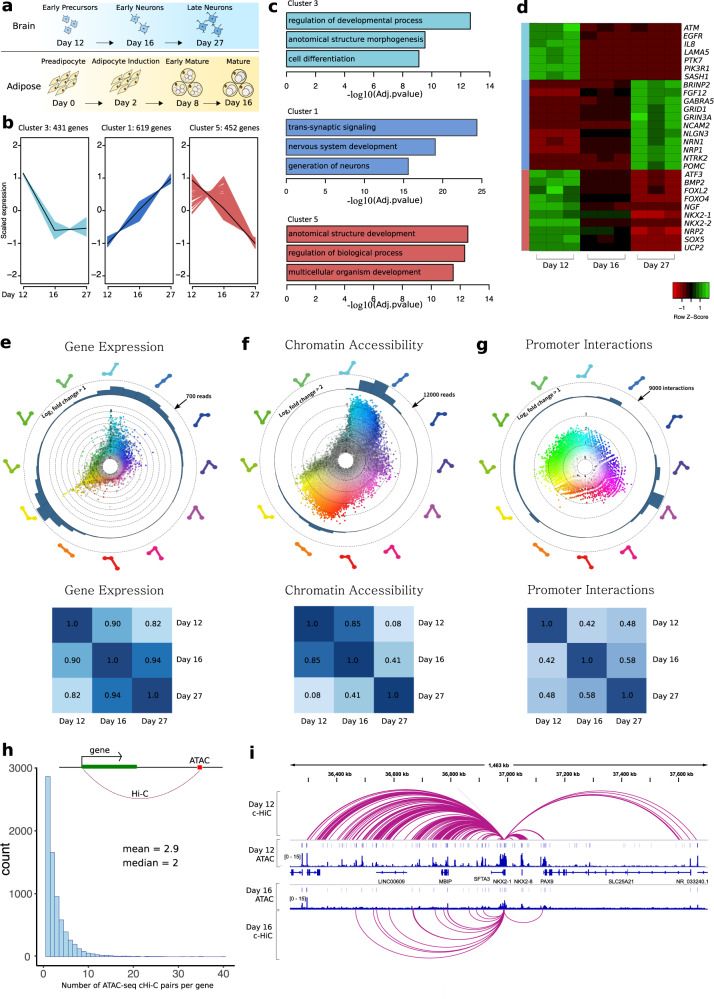
Fig. 1. Characterizing hypothalamic differentiation using genomic annotations.
a Time points for data collection. b Hypothalamic DEGs were grouped via fuzzy-c clustering and the top three clusters with the highest membership are illustrated. The number of genes in each cluster and scaled expression across the four differentiation time points are shown on each graph. c Significant Gene Ontology (GO) terms for the top three clusters. (Fisher’s Exact Test; FDR adjusted p values are presented). d A heatmap of gene expression depicting genes from each of the top three clusters that are members of the enriched GO terms. The leftmost colored bar indicates cluster membership and the columns are RNA-seq replicates. e–g HSV transformation of gene expression dynamics, ATAC-seq accessibility, and cHi–C interactions across differentiation. Each significant data point is categorized and colored based on the temporal pattern it displays shown by the guides on the periphery of each plot. The three nodes of each pattern represent day 12, day 16, and day 27 of neuronal differentiation. The distance of each point from the center of the circle represents maximum log2 fold change, and color transparency represents the relative number of reads for that data point. Below, heatmaps of Pearson’s r correlation coefficients estimate the overall similarity between time points. h On average, a promoter interacts with 2–3 ATAC-seq peaks via a c-HiC interaction across time (interactions and ATAC peaks were not required to be significant at the same time point) n = 7382 data points included. i View of significant cHi–C interactions emanating from the promoter of the NKX2-1 gene, which is downregulated between differentiation days 12–16. ATAC-seq reads and significant ATAC-seq peaks at day 12 and day 16 are also shown.

