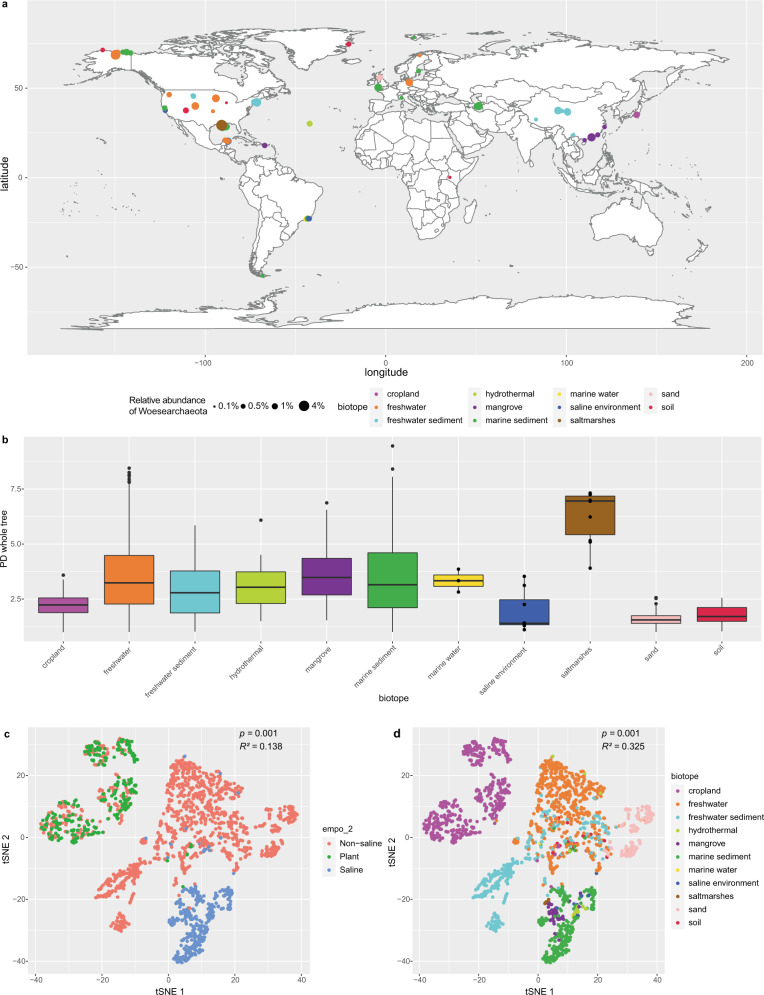
Fig. 1. Global distribution of Woesearchaeota.
a Global distribution of Woesearchaeota with at least 0.1% relative abundance, based on 2,163 16S rRNA gene amplicon datasets. Note that some libraries have the same coordinate and thus are overlapping. The world map was generated using R package “maps” v3.3.0, in R v3.6.097. b Box plot of phylogenetic diversity whole-tree index of Woesearchaeota in 11 biotopes. The median is shown in a thick black bar. The first and third quartile are shown respectively in the lower and upper bound of the box. The whiskers correspond to the 1.5 interquartile range from the bounds. The outlier is marked by dots. Data points from samples with sizes of less than or equal to ten are shown. The number of replicates used for different biotopes are as follows: freshwater: 629, cropland: 590, freshwater sediment: 365, marine sediment: 293, sand: 174, mangrove: 46, soil: 30, hydrothermal: 15, saltmarshes: 10, saline environment: 8, marine water: 3. c Beta diversity plots of Woesearchaeota community based on 2163 16S rRNA gene amplicon datasets. Beta diversity was calculated by the unweighted UniFrac metric method and tested with a 999-permutation PERMANOVA test. The dots are colored by empo_2 ontology41 which includes saline, non-saline, and plant environment. d Beta diversity plots of Woesearchaeota community based on 2163 16S rRNA gene amplicon datasets. Beta diversity was calculated by the unweighted UniFrac metric method and tested with a 999-permutation PERMANOVA test. The dots are colored according to the biotope. Source data are provided as a Source Data file.

