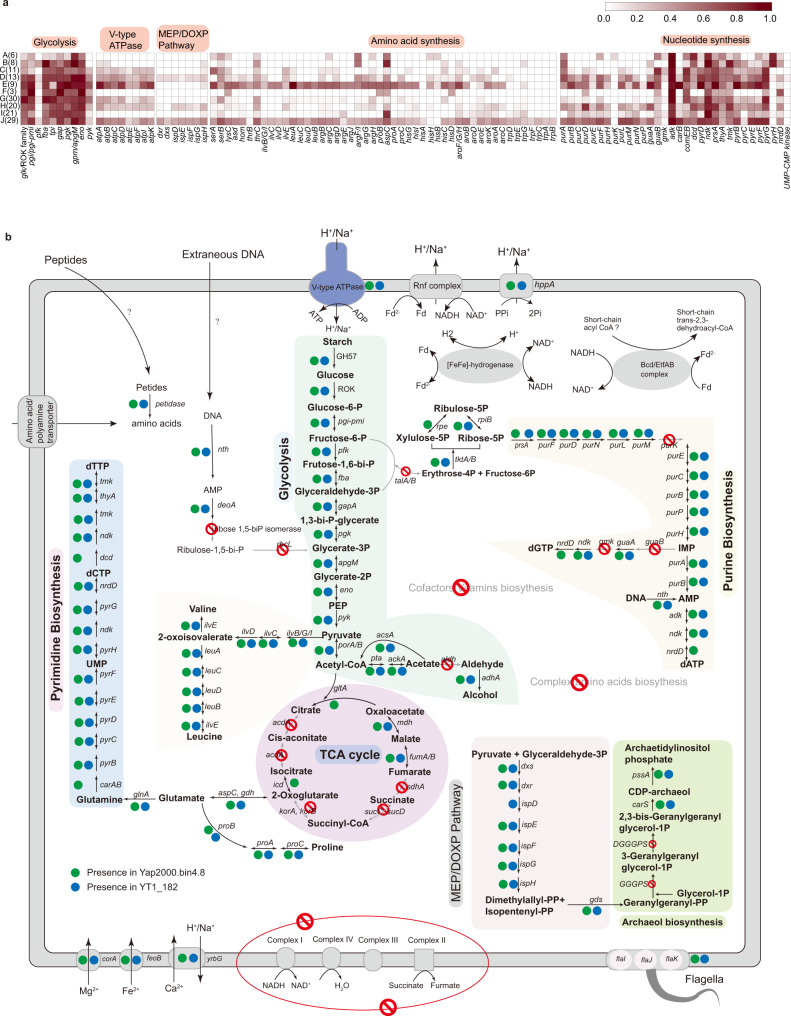
Fig. 3. Metabolic comparison of Woesearchaeota subgroups.
a Occurrence of a gene of interest in different subgroups of Woesearchaeota. The occurrence was calculated in percent across the total number of genomes included in each subgroup based on the presence/absence table. Raw data are available in Supplementary Data 3. b Reconstructed metabolic pathways of two MAGs from subgroup J, YT1_182 (estimated to be 94.61% complete and 1.96% contaminated) and Yap2000.bin4.8 (estimated to be 94.61% complete and 3.92% contaminated). A detailed list of genes encoded by these two MAGs can be found in Supplementary Data 4. Source data are provided as a Source Data file.

