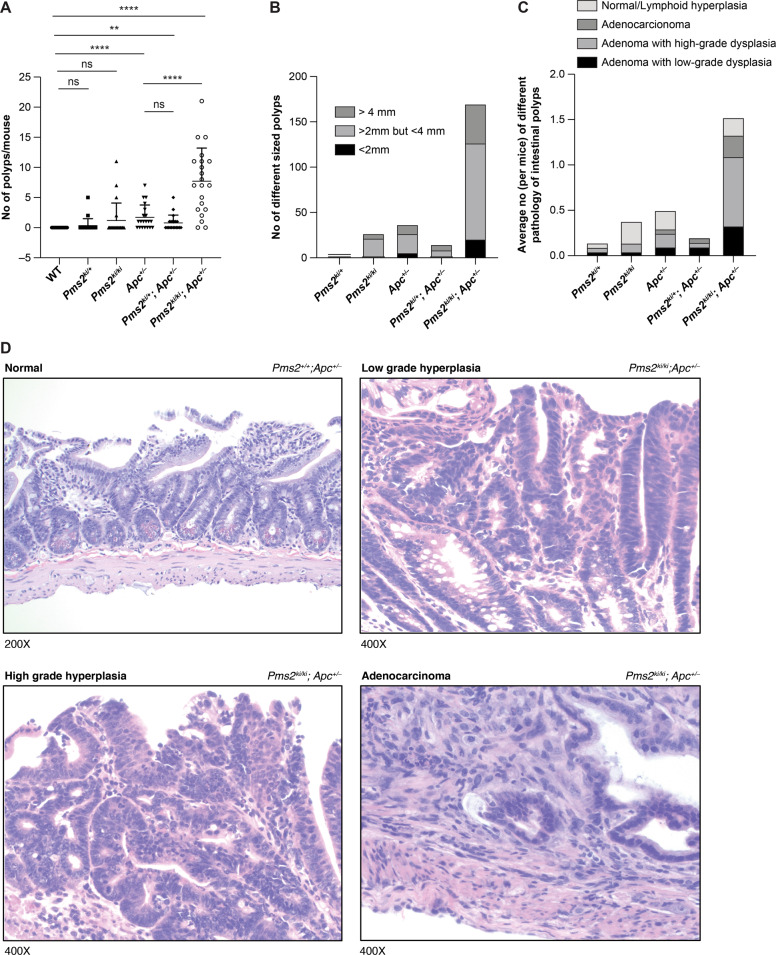
Fig. 3. Effect of Pms2 c.1993A>G mutation on intestinal polyp formation on a Apc+/− mutant genetic background.
A Numbers of intestinal polyps in 6 months old mice of different genotypes. For each group of genotypes 10 males and 10 females were included. Error bar shows mean ± s.d. ****P value < 0.0001 and **P value < 0.01. ns is non-significant. P values were calculated using Mann–Whitney test by Prism software. B Size distribution of intestinal polyps isolated from different genotypes. C Pathological distribution of intestinal polyps isolated from different genotypes. Average number was determined by dividing the total number of particular pathology found in each genotype with the number of mice studied in that group. D Representative images of different pathology (normal, low-grade hyperplasia, high-grade hyperplasia, and adenocarcinoma) of intestinal polyps. The genotypes are indicated on upper right corner and the magnification is indicated on lower left corner.

