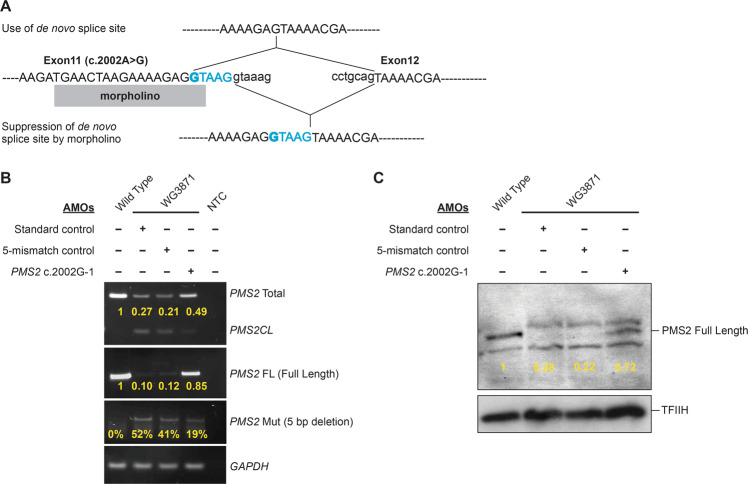
Fig. 6. PMS2 expression in morpholino-treated human cells with PMS2 c.2002A>G mutation.
A Schematic representation of the splicing defect due to PMS2 c.2002A>G mutation and use of morpholinos to block the de novo splice site. Top panel shows use of de novo splice site and bottom panel shows restoration of normal splicing by morpholinos. Morpholino is represented as a rectangular box. Exons are marked by uppercase letters and introns are in lowercase letters. 5 bases encoded by exon 11 that are deleted in the transcript due to c.2002A>G mutation are in blue and the mutation is in bold. B Quantitative PCR analysis of morpholino-treated cells shows an increase in the amount of full-length PMS2 transcript in cells treated with the PMS2 c.2002-1 AMO complementary to the novel splice site compared to cells treated with mismatched and non-PMS2 AMOs (negative controls). Treatment with the mutation-specific morpholino also results in an increase in total PMS2 transcript (full-length and aberrantly spliced). C Western blot showing levels of PMS2 protein in morpholino-treated cells. There is a clear increase in full-length PMS2 in cells treated with the mutation-specific morpholino compared to barely detectable levels of PMS2 in cells treated with the controls morpholinos. TFIIH is used as a loading control. Samples: wild-type = c.2002A/c.2002A genotype; WG3871 = c.2002G/c.2002G genotype; NTC = no template control. AMOs: Standard control Morpholino specific to a region elsewhere in the genome, 5-Mismatch control Morpholino containing 5 mismatches compared to the PMS2 c.2002G-1 morpholino, PMS2 c.2002G-1 AMO morpholino complementary to the novel splice site created by the mutation.

