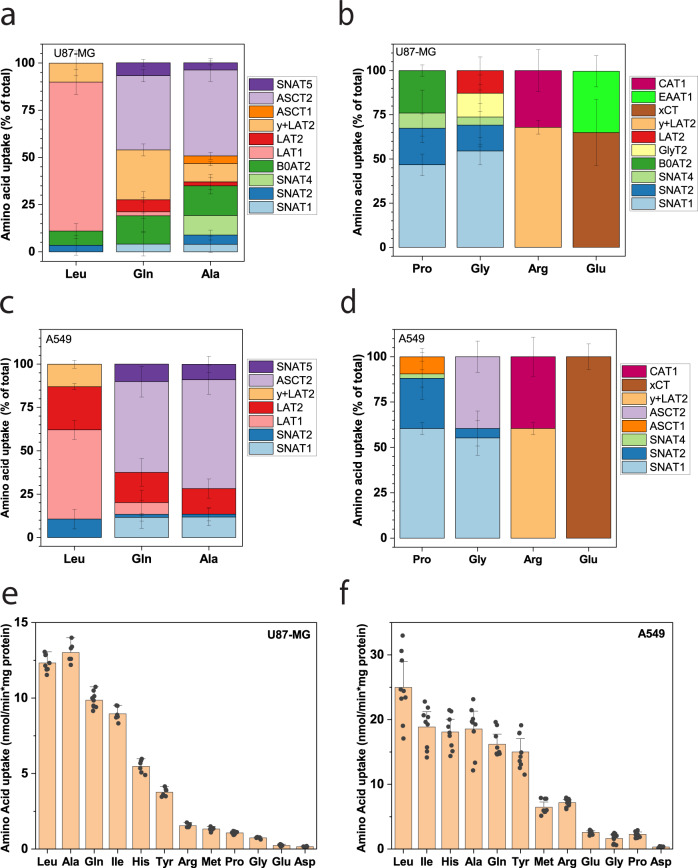
Fig. 4. Deconvolution of plasma membrane amino acid transport.
Data from Figs. 1 and 2 were combined to illustrate the contribution of individual transporters to the uptake of the indicated amino acid. a, b AA transport activities in U87-MG cells are shown, c, d shown in A549 cells. a, c High-capacity transporters are shown, b, d low-capacity transporters are shown. Data are shown as mean ± STD, the number of biologically independent samples is the same as reported in Figs. 2 and 3. To compare the uptake activity for a variety of amino acids, uptake was measured at 100 µM in U87-MG cells (e, n = 9 biologically independent samples from e = 3 independent experiments) and A549 cells (f, n = 9 biologically independent samples from e = 3 independent experiments). 95% Confidence intervals are shown for each bar. Color coding of all transporters is indicated in the legend next to the panels.

