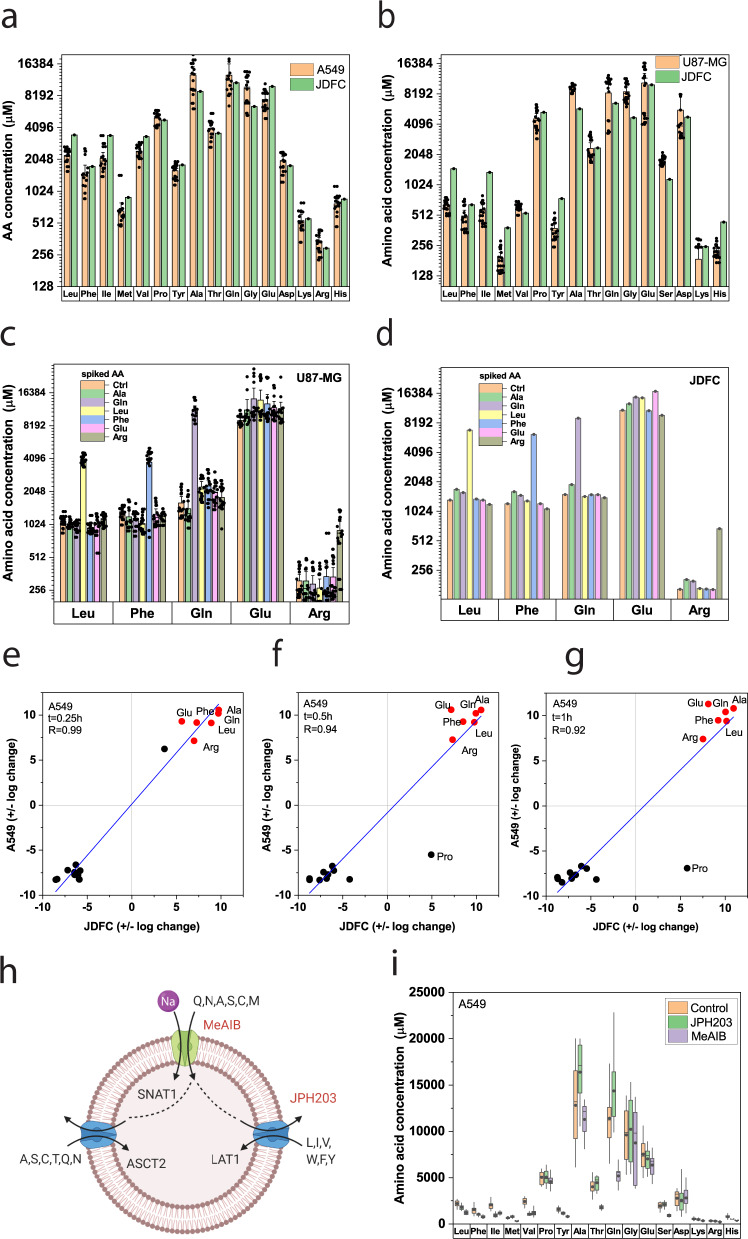
Fig. 6. Comparison of in silico and experimental data in cell lines.
a, b Cytosolic amino acid concentrations were determined by LC-MS and compared to simulated (JDFC) amino acid concentrations in A549 cells (a, n = 15, e = 3) and U87-MG cells (b, n = 15, e = 3). Cells were incubated in BME medium with nonessential amino acids for 30 min before analysis. c, d U87-MG cells were incubated with a mix of all proteinogenic amino acids (100 µM each). The indicated amino acid was then spiked at a concentration of 500 µM (n = 15, e = 3). Cytosolic amino acid concentrations were determined by LC-MS in U87-MG cells (c) and simulated using JDFC (d). e–g A549 cells were preincubated for 30 min with an amino acid mixture of all proteinogenic amino acids (100 µM each). Six amino acids (red symbols) were then spiked at a concentration of 500 µM. Cytosolic amino acid concentrations were determined by LC-MS before addition of amino acid mixtures and after 15 (e), 30 (f), and 60 (g) min (n = 15, e = 3). The correlation between experimental data and simulation were analyzed using a quadrant chart plotting the log2 change for each time point. h Scheme to illustrate tertiary active transport and the action of amino acid transport inhibitors MeAIB and JPH203. Symporters are colored in green, antiporters in blue. i Cells were incubated for 30 min in BME plus nonessential amino acids in the absence (control) and the presence of LAT1 inhibitor JPH203 and the SNAT1/2 inhibitor MeAIB. Amino acids were measured by LC-MS after 30 min (n = 15, e = 3). Experimental data are shown as mean ± 95% confidence intervals (a–c) or as box-whisker plot (i) showing range, 25–75% area, median, and mean.

