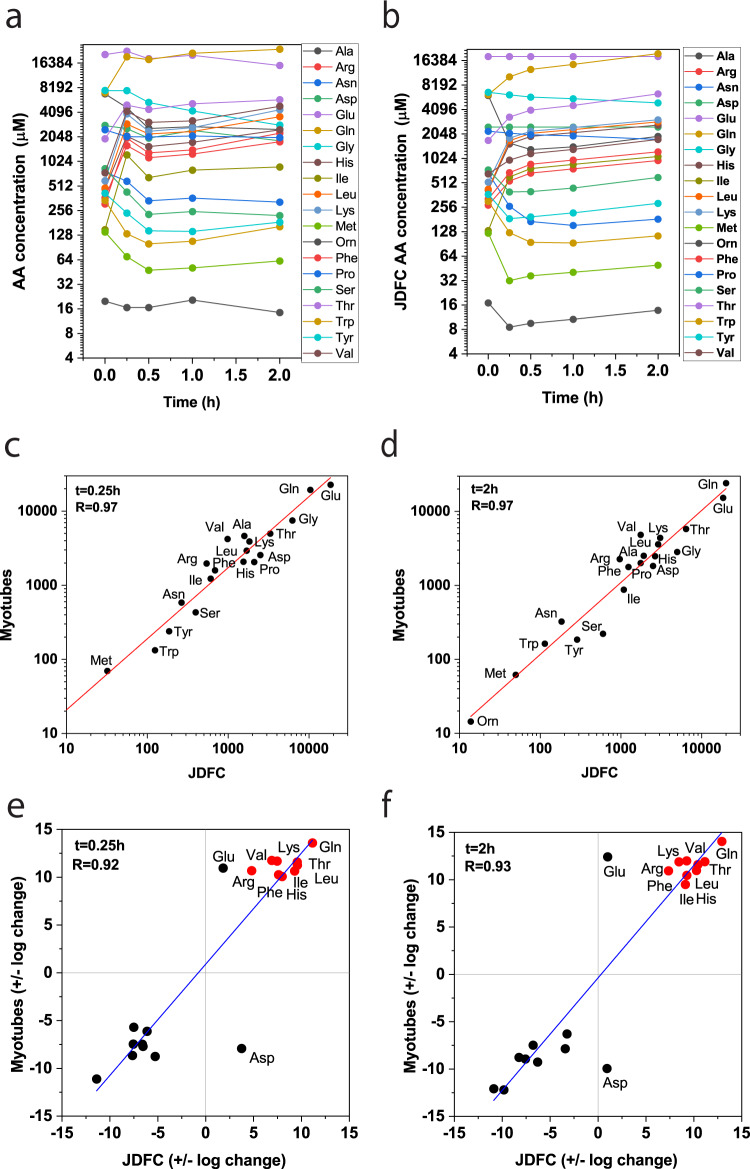
Fig. 7. Comparison of in silico and experimental data in human myotubes.
Human primary myotubes were treated with an amino acid mixture corresponding to the constituent amino acids of AXA2678 for 2 h (n = 3, e = 3). a Cytosolic amino acid concentrations were determined by LC-MS before addition of amino acid mixtures and for 2 h after addition. Cell volume was determined by morphometry. The same initial concentrations were used for JDFC and the simulation was run for 3200 cycles (b). c, d Correlation of experimental and simulated data after t = 0.25 h, R = 0.97 (c) and t = 2 h, R = 0.97 (d). e, f Correlation analysis of changes using a quadrant chart plotting the log2 change at t = 0.25 h, R = 0.92 (e) and t = 2 h, R = 0.93 (f). Spiked amino acids are shown as red dots.

