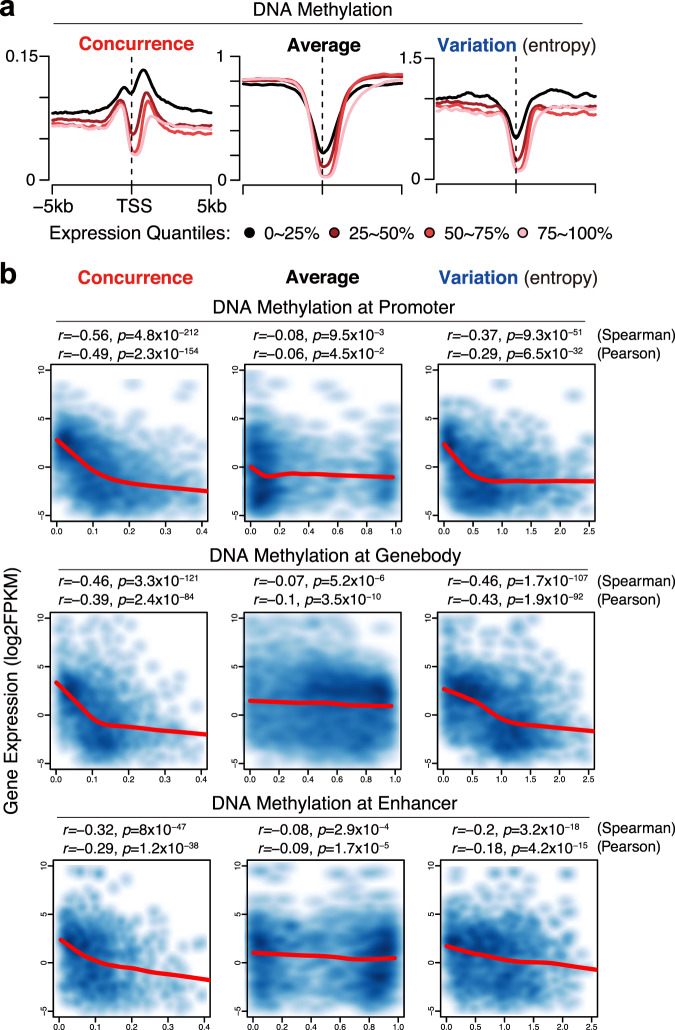
Fig. 2. Methylation concurrence is negatively associated with gene expression.
a Average profiles in TSS-proximal regions of four gene groups, divided by quantiles of expression levels, in CD3+ T cells. Methylation-concurrence ratios are on the left, average methylation ratios are in the middle, and methylation variation scores(entropy) are shown on the right. 0–25%, lowest expressed; 25–50%, lower expressed; 50–75%, higher expressed; 75–100%, highest expressed. The gene number of each group is 3600. b The promoter/gene-body/enhancer methylation concurrence ratios (1st column) are strongly negatively correlated with gene expression level in CD3+ T cells, and this correlation is stronger than that of the average methylation (2nd column) and the methylation variation (3rd column). Promoter regions are from 1 kb upstream to 500 bp downstream of TSS. Gene-body regions are from 500 bp downstream of TSS to TTS. Enhancer regions are defined based on chromatin interactions validated by Hi-C data (see Methods). The WGBS data are from the Roadmap project with GEO accession number GSM1186660. The CD3+ primary cells are from a 37-year-old male. To increase reliability, we select regulatory elements whose CpGs are all sufficiently covered (≥4 reads). To make fair comparisons, only the elements which can be detected by all three metrics are included. This results in 9876 promoter regions, 14,868 gene-body regions, and 3351 enhancer regions. Spearman’s rank correlation and Pearson’s correlation were calculated based on all data points. P values were calculated by the two-tailed correlation test. LOWESS lines were plotted to describe the relationships between variables (indicated by red curves).

